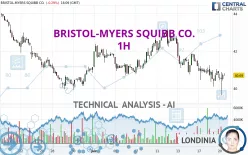
BRISTOL-MYERS SQUIBB CO. - 1H - Technical analysis published on 06/20/2024 (GMT)
- 143
- 0
Click here for a new analysis!
- Timeframe : 1H
- - Analysis generated on
- Status : INVALID

Summary of the analysis

Additional analysis
Quotes
The BRISTOL-MYERS SQUIBB CO. rating is 40.79 USD. The price is lower by -0.05% since the last closing and was traded between 39.63 USD and 40.88 USD over the period. The price is currently at +2.93% from its lowest and -0.22% from its highest.The Central Gaps scanner detects a bearish opening marking the presence of sellers ahead of buyers at the opening but not sufficiently marked to allow the price to register a quotation gap.
Bearish opening
Type : Bearish
Timeframe : Openning
A study of price movements over other periods shows the following variations:
Near a new LOW record (5 years)
Type : Bearish
Timeframe : Weekly
New LOW record (1 year)
Type : Bearish
Timeframe : Weekly
New LOW record (1st january)
Type : Bearish
Timeframe : Weekly
New LOW record (1 month)
Type : Bearish
Timeframe : Weekly
Technical
Technical analysis of BRISTOL-MYERS SQUIBB CO. in 1H shows an overall bearish trend. The signals given by moving averages are 78.57% bearish. This bearish trend is reinforced by the strong signals currently being given by short-term moving averages. The Central Indicators scanner does not detect any result on moving averages that would impact this trend.
In fact, of the 18 technical indicators analysed by Central Analyzer, 8 are bullish, 5 are neutral and 5 are bearish. But beware of excesses. The Central Indicators scanner currently detects this:
CCI indicator: bullish divergence
Type : Bullish
Timeframe : 1 hour
MACD indicator: bullish divergence
Type : Bullish
Timeframe : 1 hour
The Central Patterns scanner, which studies chart patterns, resistances and supports, has identified these signals:
Near resistance of channel
Type : Bearish
Timeframe : 1 hour
Near horizontal support
Type : Bullish
Timeframe : 1 hour
No result was found by the Central Candlesticks scanner on Japanese candlesticks.
| S3 | S2 | S1 | Price | R1 | R2 | R3 | |
|---|---|---|---|---|---|---|---|
| ProTrendLines | 37.50 | 40.25 | 40.72 | 40.79 | 41.87 | 43.19 | 44.65 |
| Change (%) | -8.07% | -1.32% | -0.17% | - | +2.65% | +5.88% | +9.46% |
| Change | -3.29 | -0.54 | -0.07 | - | +1.08 | +2.40 | +3.86 |
| Level | Major | Major | Intermediate | - | Intermediate | Intermediate | Major |
Pivot points can also be used to set your price objectives. Here is the price situation in relation to pivot points:
| Pivot points | S3 | S2 | S1 | PP | R1 | R2 | R3 |
|---|---|---|---|---|---|---|---|
| Standard | 39.04 | 39.56 | 40.19 | 40.71 | 41.34 | 41.86 | 42.49 |
| Camarilla | 40.49 | 40.60 | 40.71 | 40.81 | 40.92 | 41.02 | 41.13 |
| Woodie | 39.09 | 39.59 | 40.24 | 40.74 | 41.39 | 41.89 | 42.54 |
| Fibonacci | 39.56 | 40.00 | 40.27 | 40.71 | 41.15 | 41.42 | 41.86 |
| Pivot points | S3 | S2 | S1 | PP | R1 | R2 | R3 |
|---|---|---|---|---|---|---|---|
| Standard | 37.80 | 39.27 | 40.24 | 41.71 | 42.68 | 44.15 | 45.12 |
| Camarilla | 40.53 | 40.75 | 40.98 | 41.20 | 41.42 | 41.65 | 41.87 |
| Woodie | 37.54 | 39.15 | 39.98 | 41.59 | 42.42 | 44.03 | 44.86 |
| Fibonacci | 39.27 | 40.21 | 40.78 | 41.71 | 42.65 | 43.22 | 44.15 |
| Pivot points | S3 | S2 | S1 | PP | R1 | R2 | R3 |
|---|---|---|---|---|---|---|---|
| Standard | 32.95 | 36.43 | 38.76 | 42.24 | 44.57 | 48.05 | 50.38 |
| Camarilla | 39.49 | 40.03 | 40.56 | 41.09 | 41.62 | 42.16 | 42.69 |
| Woodie | 32.38 | 36.14 | 38.19 | 41.95 | 44.00 | 47.76 | 49.81 |
| Fibonacci | 36.43 | 38.65 | 40.02 | 42.24 | 44.46 | 45.83 | 48.05 |
Numerical data
The following are the details of the technical indicators and moving averages that were collected to generate this technical analysis:
| RSI (14): | 44.87 | |
| MACD (12,26,9): | -0.2500 | |
| Directional Movement: | -24.62 | |
| AROON (14): | -57.15 | |
| DEMA (21): | 40.56 | |
| Parabolic SAR (0,02-0,02-0,2): | 41.05 | |
| Elder Ray (13): | -0.16 | |
| Super Trend (3,10): | 41.49 | |
| Zig ZAG (10): | 40.70 | |
| VORTEX (21): | 0.9000 | |
| Stochastique (14,3,5): | 53.58 | |
| TEMA (21): | 40.48 | |
| Williams %R (14): | -33.54 | |
| Chande Momentum Oscillator (20): | -0.16 | |
| Repulse (5,40,3): | 1.1800 | |
| ROCnROLL: | 2 | |
| TRIX (15,9): | -0.1000 | |
| Courbe Coppock: | 2.18 |
| MA7: | 41.52 | |
| MA20: | 41.37 | |
| MA50: | 44.07 | |
| MA100: | 47.34 | |
| MAexp7: | 40.70 | |
| MAexp20: | 40.90 | |
| MAexp50: | 41.26 | |
| MAexp100: | 41.54 | |
| Price / MA7: | -1.76% | |
| Price / MA20: | -1.40% | |
| Price / MA50: | -7.44% | |
| Price / MA100: | -13.84% | |
| Price / MAexp7: | +0.22% | |
| Price / MAexp20: | -0.27% | |
| Price / MAexp50: | -1.14% | |
| Price / MAexp100: | -1.81% |
News
The latest news and videos published on BRISTOL-MYERS SQUIBB CO. at the time of the analysis were as follows:
- ASPIRE: Our Commitment To Address Health Inequities in Low- and Middle-Income Countries
- Bristol Myers Squibb Announces 10-Year Strategy to Reach More Patients in Low- and Middle-Income Countries
- Building a Better Future: Bristol Myers Squibb 2023 ESG Report
- Bristol Myers Squibb Releases 2023 ESG Report Demonstrating Progress and Setting New Long-Term Goals
- Bristol Myers Squibb Releases 2023 Environmental, Social and Governance Report Demonstrating Progress and Setting New Long-Term Goals
About author
Online


Add a comment
Comments
0 comments on the analysis BRISTOL-MYERS SQUIBB CO. - 1H