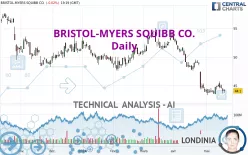
BRISTOL-MYERS SQUIBB CO. - Daily - Technical analysis published on 05/17/2024 (GMT)
- 149
- 0
Click here for a new analysis!
- Timeframe : Daily
- - Analysis generated on
- Status : TARGET REACHED

Summary of the analysis

Additional analysis
Quotes
The BRISTOL-MYERS SQUIBB CO. price is 44.10 USD. The price is lower by -0.02% since the last closing with the lowest point at 43.73 USD and the highest point at 44.30 USD. The deviation from the price is +0.85% for the low point and -0.45% for the high point.The Central Gaps scanner detects a bullish opening marking the presence of buyers ahead of sellers at the opening but not sufficiently marked to allow the price to register a quotation gap.
Bullish opening
Type : Bullish
Timeframe : Openning
A study of price movements over other periods shows the following variations:
Near a new LOW record (1 year)
Type : Bearish
Timeframe : Weekly
Near a new LOW record (1st january)
Type : Bearish
Timeframe : Weekly
Near a new LOW record (1 month)
Type : Bearish
Timeframe : Weekly
Technical
A technical analysis in Daily of this BRISTOL-MYERS SQUIBB CO. chart shows a sharp bearish trend. The signals given by moving averages are 92.86% bearish. This strong bearish trend is confirmed by the strong signals currently being given by short-term moving averages. The Central Indicators market scanner currently does not detect any result that concerns moving averages.
On the 18 technical indicators analysed, 6 are bullish, 4 are neutral and 8 are bearish. Other results related to technical indicators were also found by the Central Indicators scanner:
Price is back under the pivot point
Type : Bearish
Timeframe : Daily
Price is back under the pivot point
Type : Bearish
Timeframe : Weekly
Momentum indicator is back under 0
Type : Bearish
Timeframe : Daily
The Central Patterns scanner, which studies chart patterns, resistances and supports, has identified these signals:
Near horizontal resistance
Type : Bearish
Timeframe : Daily
Near support of channel
Type : Bullish
Timeframe : Daily
No result was found by the Central Candlesticks scanner on Japanese candlesticks.
| S3 | S2 | S1 | Price | R1 | R2 | R3 | |
|---|---|---|---|---|---|---|---|
| ProTrendLines | 13.25 | 18.56 | 37.50 | 44.10 | 44.65 | 47.41 | 49.96 |
| Change (%) | -69.95% | -57.91% | -14.97% | - | +1.25% | +7.51% | +13.29% |
| Change | -30.85 | -25.54 | -6.60 | - | +0.55 | +3.31 | +5.86 |
| Level | Minor | Minor | Major | - | Major | Major | Major |
Attention could also be paid to pivot points to set price objectives:
| Pivot points | S3 | S2 | S1 | PP | R1 | R2 | R3 |
|---|---|---|---|---|---|---|---|
| Standard | 42.83 | 43.26 | 43.68 | 44.11 | 44.53 | 44.96 | 45.38 |
| Camarilla | 43.88 | 43.95 | 44.03 | 44.11 | 44.19 | 44.27 | 44.34 |
| Woodie | 42.84 | 43.26 | 43.69 | 44.11 | 44.54 | 44.96 | 45.39 |
| Fibonacci | 43.26 | 43.58 | 43.78 | 44.11 | 44.43 | 44.63 | 44.96 |
| Pivot points | S3 | S2 | S1 | PP | R1 | R2 | R3 |
|---|---|---|---|---|---|---|---|
| Standard | 42.48 | 42.99 | 43.96 | 44.47 | 45.44 | 45.95 | 46.92 |
| Camarilla | 44.53 | 44.67 | 44.80 | 44.94 | 45.08 | 45.21 | 45.35 |
| Woodie | 42.72 | 43.11 | 44.20 | 44.59 | 45.68 | 46.07 | 47.16 |
| Fibonacci | 42.99 | 43.55 | 43.90 | 44.47 | 45.03 | 45.38 | 45.95 |
| Pivot points | S3 | S2 | S1 | PP | R1 | R2 | R3 |
|---|---|---|---|---|---|---|---|
| Standard | 31.03 | 37.48 | 40.71 | 47.16 | 50.39 | 56.84 | 60.07 |
| Camarilla | 41.28 | 42.17 | 43.05 | 43.94 | 44.83 | 45.72 | 46.60 |
| Woodie | 29.42 | 36.68 | 39.10 | 46.36 | 48.78 | 56.04 | 58.46 |
| Fibonacci | 37.48 | 41.18 | 43.46 | 47.16 | 50.86 | 53.14 | 56.84 |
Numerical data
The following is the status of technical indicators and moving averages registered at the time this technical analysis was created:
| RSI (14): | 33.50 | |
| MACD (12,26,9): | -1.2100 | |
| Directional Movement: | -14.57 | |
| AROON (14): | 57.14 | |
| DEMA (21): | 43.62 | |
| Parabolic SAR (0,02-0,02-0,2): | 45.67 | |
| Elder Ray (13): | -0.72 | |
| Super Trend (3,10): | 46.59 | |
| Zig ZAG (10): | 44.10 | |
| VORTEX (21): | 0.8400 | |
| Stochastique (14,3,5): | 39.13 | |
| TEMA (21): | 43.48 | |
| Williams %R (14): | -66.56 | |
| Chande Momentum Oscillator (20): | -0.09 | |
| Repulse (5,40,3): | -1.2800 | |
| ROCnROLL: | 2 | |
| TRIX (15,9): | -0.4500 | |
| Courbe Coppock: | 6.18 |
| MA7: | 44.60 | |
| MA20: | 45.04 | |
| MA50: | 48.68 | |
| MA100: | 49.23 | |
| MAexp7: | 44.40 | |
| MAexp20: | 45.34 | |
| MAexp50: | 47.36 | |
| MAexp100: | 49.08 | |
| Price / MA7: | -1.12% | |
| Price / MA20: | -2.09% | |
| Price / MA50: | -9.41% | |
| Price / MA100: | -10.42% | |
| Price / MAexp7: | -0.68% | |
| Price / MAexp20: | -2.73% | |
| Price / MAexp50: | -6.88% | |
| Price / MAexp100: | -10.15% |
News
The latest news and videos published on BRISTOL-MYERS SQUIBB CO. at the time of the analysis were as follows:
- Building a Better Future: Bristol Myers Squibb 2023 ESG Report
- Bristol Myers Squibb Releases 2023 ESG Report Demonstrating Progress and Setting New Long-Term Goals
- Bristol Myers Squibb Releases 2023 Environmental, Social and Governance Report Demonstrating Progress and Setting New Long-Term Goals
- Bristol Myers Squibb Expands Health Equity Grant Initiatives to Improve Health Outcomes
- Bristol Myers Squibb Named One of America’s Most JUST Companies by JUST Capital and CNBC
About author
Online


Add a comment
Comments
0 comments on the analysis BRISTOL-MYERS SQUIBB CO. - Daily