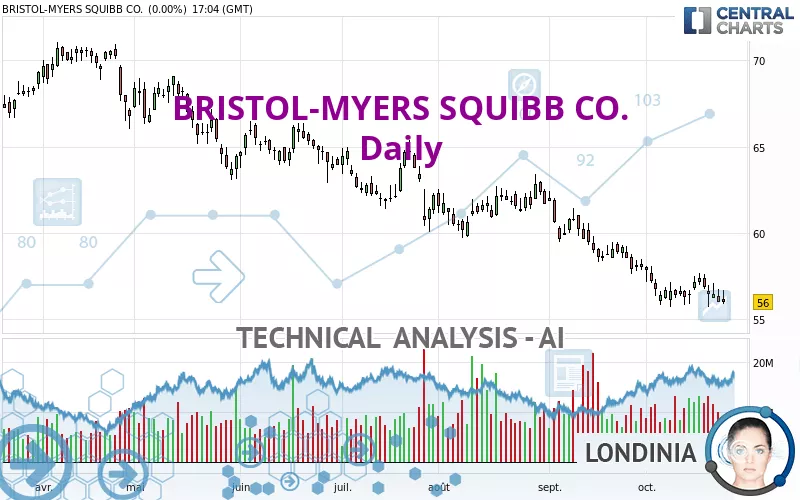
BRISTOL-MYERS SQUIBB CO. - Daily - Technical analysis published on 10/24/2023 (GMT)
- 172
- 0
Click here for a new analysis!
- Timeframe : Daily
- - Analysis generated on
- Status : TARGET REACHED

Summary of the analysis

Additional analysis
Quotes
The BRISTOL-MYERS SQUIBB CO. rating is 55.99 USD. On the day, this instrument lost -0.02% with the lowest point at 55.88 USD and the highest point at 56.68 USD. The deviation from the price is +0.20% for the low point and -1.22% for the high point.The Central Gaps scanner detects a bullish opening. A small advantage for buyers in the very short term.
Bullish opening
Type : Bullish
Timeframe : Openning
A study of price movements over other periods shows the following variations:
Near a new LOW record (1 year)
Type : Bearish
Timeframe : Weekly
Near a new LOW record (1st january)
Type : Bearish
Timeframe : Weekly
Near a new HIGH record (1 month)
Type : Bullish
Timeframe : Weekly
Technical
Technical analysis of BRISTOL-MYERS SQUIBB CO. in Daily shows a overall strongly bearish trend. 92.86% of the signals given by moving averages are bearish. The overall trend is supported by the strong bearish signals from short-term moving averages. The Central Indicators market scanner currently does not detect any result that concerns moving averages.
In fact, of the 18 technical indicators analysed by Central Analyzer, 4 are bullish, 5 are neutral and 9 are bearish. Caution: the Central Indicators scanner currently detects an excess:
RSI indicator: bullish divergence
Type : Bullish
Timeframe : Daily
Williams %R indicator is oversold : under -80
Type : Neutral
Timeframe : Daily
The Central Patterns scanner, which studies chart patterns, resistances and supports, has identified this signal:
Near horizontal support
Type : Bullish
Timeframe : Daily
The Central Candlesticks scanner currently notes the presence of this pattern in Japanese candlesticks that could mark the end of the short-term trend currently underway:
Black hanging man / hammer
Type : Neutral
Timeframe : Daily
| S3 | S2 | S1 | Price | R1 | R2 | R3 | |
|---|---|---|---|---|---|---|---|
| ProTrendLines | 41.90 | 51.13 | 55.31 | 55.99 | 58.36 | 60.16 | 62.64 |
| Change (%) | -25.17% | -8.68% | -1.21% | - | +4.23% | +7.45% | +11.88% |
| Change | -14.09 | -4.86 | -0.68 | - | +2.37 | +4.17 | +6.65 |
| Level | Minor | Major | Intermediate | - | Intermediate | Minor | Intermediate |
Pivot points can also be used to set your price objectives. Here is the price situation in relation to pivot points:
| Pivot points | S3 | S2 | S1 | PP | R1 | R2 | R3 |
|---|---|---|---|---|---|---|---|
| Standard | 54.99 | 55.48 | 55.74 | 56.23 | 56.49 | 56.98 | 57.24 |
| Camarilla | 55.79 | 55.86 | 55.93 | 56.00 | 56.07 | 56.14 | 56.21 |
| Woodie | 54.88 | 55.42 | 55.63 | 56.17 | 56.38 | 56.92 | 57.13 |
| Fibonacci | 55.48 | 55.77 | 55.94 | 56.23 | 56.52 | 56.69 | 56.98 |
| Pivot points | S3 | S2 | S1 | PP | R1 | R2 | R3 |
|---|---|---|---|---|---|---|---|
| Standard | 53.64 | 54.68 | 55.57 | 56.61 | 57.50 | 58.54 | 59.43 |
| Camarilla | 55.93 | 56.11 | 56.28 | 56.46 | 56.64 | 56.81 | 56.99 |
| Woodie | 53.57 | 54.64 | 55.50 | 56.57 | 57.43 | 58.50 | 59.36 |
| Fibonacci | 54.68 | 55.42 | 55.87 | 56.61 | 57.35 | 57.80 | 58.54 |
| Pivot points | S3 | S2 | S1 | PP | R1 | R2 | R3 |
|---|---|---|---|---|---|---|---|
| Standard | 51.51 | 54.56 | 56.30 | 59.35 | 61.09 | 64.14 | 65.88 |
| Camarilla | 56.72 | 57.16 | 57.60 | 58.04 | 58.48 | 58.92 | 59.36 |
| Woodie | 50.86 | 54.23 | 55.65 | 59.02 | 60.44 | 63.81 | 65.23 |
| Fibonacci | 54.56 | 56.39 | 57.52 | 59.35 | 61.18 | 62.31 | 64.14 |
Numerical data
The following are the details of the technical indicators and moving averages that were collected to generate this technical analysis:
| RSI (14): | 32.08 | |
| MACD (12,26,9): | -0.7900 | |
| Directional Movement: | -18.04 | |
| AROON (14): | 42.86 | |
| DEMA (21): | 55.95 | |
| Parabolic SAR (0,02-0,02-0,2): | 57.54 | |
| Elder Ray (13): | -0.38 | |
| Super Trend (3,10): | 58.78 | |
| Zig ZAG (10): | 55.90 | |
| VORTEX (21): | 0.8300 | |
| Stochastique (14,3,5): | 19.89 | |
| TEMA (21): | 55.97 | |
| Williams %R (14): | -89.80 | |
| Chande Momentum Oscillator (20): | -0.77 | |
| Repulse (5,40,3): | -2.2300 | |
| ROCnROLL: | 2 | |
| TRIX (15,9): | -0.2200 | |
| Courbe Coppock: | 3.33 |
| MA7: | 56.61 | |
| MA20: | 56.88 | |
| MA50: | 59.12 | |
| MA100: | 61.12 | |
| MAexp7: | 56.39 | |
| MAexp20: | 57.07 | |
| MAexp50: | 58.70 | |
| MAexp100: | 60.93 | |
| Price / MA7: | -1.10% | |
| Price / MA20: | -1.56% | |
| Price / MA50: | -5.29% | |
| Price / MA100: | -8.39% | |
| Price / MAexp7: | -0.71% | |
| Price / MAexp20: | -1.89% | |
| Price / MAexp50: | -4.62% | |
| Price / MAexp100: | -8.11% |
News
The last news published on BRISTOL-MYERS SQUIBB CO. at the time of the generation of this analysis was as follows:
- Biking the Globe for C2C4C
- Moments of Serendipity As Our Teams 'Light the Night'
- Cancer Care Milestone Reached in Lesotho
- Bristol Myers Squibb Completes Acquisition of MyoKardia, Strengthening Company’s Leading Cardiovascular Franchise
- Bristol Myers Squibb and MyoKardia Announce Expiration of HSR Act Waiting Period
About author
Online


Add a comment
Comments
0 comments on the analysis BRISTOL-MYERS SQUIBB CO. - Daily