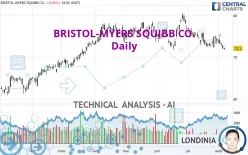
BRISTOL-MYERS SQUIBB CO. - Daily - Technical analysis published on 08/05/2022 (GMT)
- 268
- 0
Click here for a new analysis!
- Timeframe : Daily
- - Analysis generated on
- Status : INVALID

Summary of the analysis

Additional analysis
Quotes
The BRISTOL-MYERS SQUIBB CO. rating is 72.10 USD. The price registered a decrease of -0.03% on the session and was between 71.71 USD and 72.36 USD. This implies that the price is at +0.54% from its lowest and at -0.36% from its highest.The Central Gaps scanner detects a bearish opening marking the presence of sellers ahead of buyers at the opening but not sufficiently marked to allow the price to register a quotation gap.
Bearish opening
Type : Bearish
Timeframe : Openning
So that you have an overall view of the price change, here is a table showing the variations over several periods:
New LOW record (1 month)
Type : Bearish
Timeframe : Weekly
Technical
Technical analysis of this Daily chart of BRISTOL-MYERS SQUIBB CO. indicates that the overall trend is bearish. The signals given by moving averages are 71.43% bearish. This bearish trend is reinforced by the strong signals currently being given by short-term moving averages. The Central Indicators scanner does not detect any result on moving averages that would impact this trend.
The probability of a further decline is moderate given the direction of the technical indicators.
Caution: the Central Indicators scanner currently detects an excess:
CCI indicator is oversold : under -100
Type : Neutral
Timeframe : Daily
Williams %R indicator is oversold : under -80
Type : Neutral
Timeframe : Daily
Pivot points : price is under support 1
Type : Neutral
Timeframe : Weekly
The Central Patterns scanner, which studies chart patterns, resistances and supports, has identified this signal:
Support of channel is broken
Type : Bearish
Timeframe : Daily
The Central Candlesticks scanner, specialised in Japanese candlesticks, did not identify any signals.
| S3 | S2 | S1 | Price | R1 | R2 | R3 | |
|---|---|---|---|---|---|---|---|
| ProTrendLines | 52.40 | 61.30 | 64.19 | 72.10 | 72.11 | 74.67 | 77.14 |
| Change (%) | -27.32% | -14.98% | -10.97% | - | +0.01% | +3.56% | +6.99% |
| Change | -19.70 | -10.80 | -7.91 | - | +0.01 | +2.57 | +5.04 |
| Level | Major | Minor | Major | - | Intermediate | Intermediate | Major |
To determine price objectives, it is also possible to use the pivot points. Here is the price position in relation to pivot points:
| Pivot points | S3 | S2 | S1 | PP | R1 | R2 | R3 |
|---|---|---|---|---|---|---|---|
| Standard | 70.76 | 71.37 | 71.74 | 72.35 | 72.72 | 73.33 | 73.70 |
| Camarilla | 71.85 | 71.94 | 72.03 | 72.12 | 72.21 | 72.30 | 72.39 |
| Woodie | 70.65 | 71.31 | 71.63 | 72.29 | 72.61 | 73.27 | 73.59 |
| Fibonacci | 71.37 | 71.74 | 71.97 | 72.35 | 72.72 | 72.95 | 73.33 |
| Pivot points | S3 | S2 | S1 | PP | R1 | R2 | R3 |
|---|---|---|---|---|---|---|---|
| Standard | 69.41 | 70.83 | 72.31 | 73.73 | 75.21 | 76.63 | 78.11 |
| Camarilla | 72.98 | 73.25 | 73.51 | 73.78 | 74.05 | 74.31 | 74.58 |
| Woodie | 69.43 | 70.85 | 72.33 | 73.75 | 75.23 | 76.65 | 78.13 |
| Fibonacci | 70.83 | 71.94 | 72.63 | 73.73 | 74.84 | 75.53 | 76.63 |
| Pivot points | S3 | S2 | S1 | PP | R1 | R2 | R3 |
|---|---|---|---|---|---|---|---|
| Standard | 66.82 | 69.54 | 71.66 | 74.38 | 76.50 | 79.22 | 81.34 |
| Camarilla | 72.45 | 72.89 | 73.34 | 73.78 | 74.22 | 74.67 | 75.11 |
| Woodie | 66.52 | 69.39 | 71.36 | 74.23 | 76.20 | 79.07 | 81.04 |
| Fibonacci | 69.54 | 71.39 | 72.53 | 74.38 | 76.23 | 77.37 | 79.22 |
Numerical data
The following is the status of technical indicators and moving averages registered at the time this technical analysis was created:
| RSI (14): | 36.96 | |
| MACD (12,26,9): | -0.6900 | |
| Directional Movement: | -5.12 | |
| AROON (14): | -100.00 | |
| DEMA (21): | 72.88 | |
| Parabolic SAR (0,02-0,02-0,2): | 74.34 | |
| Elder Ray (13): | -1.32 | |
| Super Trend (3,10): | 75.89 | |
| Zig ZAG (10): | 72.11 | |
| VORTEX (21): | 0.8700 | |
| Stochastique (14,3,5): | 12.05 | |
| TEMA (21): | 72.47 | |
| Williams %R (14): | -88.26 | |
| Chande Momentum Oscillator (20): | -0.71 | |
| Repulse (5,40,3): | -1.2600 | |
| ROCnROLL: | 2 | |
| TRIX (15,9): | -0.1100 | |
| Courbe Coppock: | 3.25 |
| MA7: | 73.23 | |
| MA20: | 73.72 | |
| MA50: | 74.82 | |
| MA100: | 74.63 | |
| MAexp7: | 72.92 | |
| MAexp20: | 73.73 | |
| MAexp50: | 74.31 | |
| MAexp100: | 73.16 | |
| Price / MA7: | -1.54% | |
| Price / MA20: | -2.20% | |
| Price / MA50: | -3.64% | |
| Price / MA100: | -3.39% | |
| Price / MAexp7: | -1.12% | |
| Price / MAexp20: | -2.21% | |
| Price / MAexp50: | -2.97% | |
| Price / MAexp100: | -1.45% |
News
The last news published on BRISTOL-MYERS SQUIBB CO. at the time of the generation of this analysis was as follows:
- Bristol Myers Squibb Completes Acquisition of MyoKardia, Strengthening Company’s Leading Cardiovascular Franchise
- Bristol Myers Squibb and MyoKardia Announce Expiration of HSR Act Waiting Period
- Thinking about buying stock in Apple, Bristol-Myers Squibb, Cronos Group, Coca-Cola, or Walgreens Boots Alliance?
-
 Bristol hospital introduces 'zero tolerance' policy on staff abuse
- CheckMate -9LA, a Phase 3 Trial Evaluating Opdivo (nivolumab) Plus Low-Dose Yervoy (ipilimumab) Combined with Chemotherapy, Meets Primary Endpoint Demonstrating Superior Overall Survival Compared to Chemotherapy Alone in First-Line Lung Cancer
About author
Online


Add a comment
Comments
0 comments on the analysis BRISTOL-MYERS SQUIBB CO. - Daily