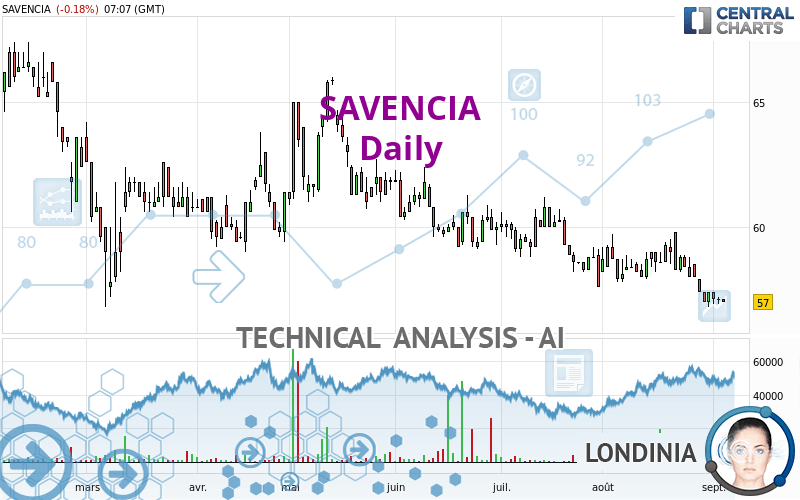
SAVENCIA - Daily - Technical analysis published on 09/05/2022 (GMT)
- 170
- 0
I am delighted to see that my first price objective has been achieved. I hope you've taken advantage of it.
Click here for a new analysis!
Click here for a new analysis!
- Timeframe : Daily
- - Analysis generated on
- Status : TARGET REACHED

Summary of the analysis
Trends
Short term:
Strongly bearish
Underlying:
Strongly bearish
Technical indicators
11%
67%
22%
My opinion
Bearish under 58.8 EUR
My targets
52.2 EUR (-8.42%)
45.9 EUR (-19.47%)
My analysis
All elements being clearly bearish, it would be possible for traders to trade only short positions (for sale) on SAVENCIA as long as the price remains well below 58.8 EUR. The sellers' bearish objective is set at 52.2 EUR. A bearish break of this support would revive the bearish momentum. The sellers could then target the support located at 45.9 EUR. In case of crossing, the next objective would be the support located at 36.7 EUR. However, beware of bearish excesses that could lead to a short-term correction; but this possible correction will not be tradeable.
In the very short term, the general bearish sentiment is confirmed by technical indicators. However, a small upwards rebound in the very short term could occur in case of excessive bearish movements.
Force
0
10
7.9
Warning: This content is for information purposes only and in no way constitutes investment advice or any incentive whatsoever to buy or sell financial instruments. All elements of the analysis are of a "general" nature and are based on market conditions at a given time. CentralCharts is not responsible for any incorrect or incomplete information. Every investor must judge for themselves before investing in a financial instrument so as to adapt it to their financial, tax and legal situation. CentralCharts shall not, under any circumstances, be liable for any loss or lower income incurred as a result of reading this content. Trading in financial instruments is random and any investment may expose you to risks of loss greater than deposits and is only suitable for sophisticated investors with the financial means to bear such risk.

This analysis was given by Londinia. Take part yourself by sharing additional analysis on another time unit:
Additional analysis
Quotes
The SAVENCIA price is 57.0 EUR. On the day, this instrument lost -0.18% and was traded between 57.0 EUR and 57.1 EUR over the period. The price is currently at 0% from its lowest and -0.18% from its highest.57.0
57.1
57.0
Here is a more detailed summary of the historical variations registered by SAVENCIA:
Near a new LOW record (1 year)
Type : Bearish
Timeframe : Weekly
Near a new LOW record (1st january)
Type : Bearish
Timeframe : Weekly
Near a new HIGH record (1 month)
Type : Bullish
Timeframe : Weekly
Technical
Technical analysis of this Daily chart of SAVENCIA indicates that the overall trend is strongly bearish. The signals given by moving averages are 92.86% bearish. This strong bearish trend is confirmed by the strong signals currently being given by short-term moving averages. The Central Indicators scanner does not detect any result on moving averages that would impact this trend.
An assessment of technical indicators shows a bearish signal.
Caution: the Central Indicators scanner currently detects an excess:
CCI indicator is oversold : under -100
Type : Neutral
Timeframe : Daily
Williams %R indicator is oversold : under -80
Type : Neutral
Timeframe : Daily
Price is back under the pivot point
Type : Bearish
Timeframe : Daily
No signals are given by Central Patterns, a market scanner specialised in chart patterns, resistances and supports.
The Central Candlesticks scanner, specialised in Japanese candlesticks, did not identify any signals.
ProTrendLines
S3
S2
S1
R1
R2
R3
Price
| S3 | S2 | S1 | Price | R1 | R2 | R3 | |
|---|---|---|---|---|---|---|---|
| ProTrendLines | 45.9 | 52.2 | 56.6 | 57.0 | 57.6 | 58.8 | 60.8 |
| Change (%) | -19.47% | -8.42% | -0.70% | - | +1.05% | +3.16% | +6.67% |
| Change | -11.1 | -4.8 | -0.4 | - | +0.6 | +1.8 | +3.8 |
| Level | Major | Minor | Major | - | Minor | Intermediate | Minor |
Pivot points can also be used to set your price objectives. Here is the price situation in relation to pivot points:
Daily
| Pivot points | S3 | S2 | S1 | PP | R1 | R2 | R3 |
|---|---|---|---|---|---|---|---|
| Standard | 56.6 | 56.8 | 56.9 | 57.1 | 57.2 | 57.4 | 57.5 |
| Camarilla | 57.0 | 57.1 | 57.1 | 57.1 | 57.1 | 57.2 | 57.2 |
| Woodie | 56.7 | 56.8 | 57.0 | 57.1 | 57.3 | 57.4 | 57.6 |
| Fibonacci | 56.8 | 56.9 | 57.0 | 57.1 | 57.2 | 57.3 | 57.4 |
Weekly
| Pivot points | S3 | S2 | S1 | PP | R1 | R2 | R3 |
|---|---|---|---|---|---|---|---|
| Standard | 55.5 | 56.2 | 56.6 | 57.3 | 57.7 | 58.4 | 58.8 |
| Camarilla | 56.8 | 56.9 | 57.0 | 57.1 | 57.2 | 57.3 | 57.4 |
| Woodie | 55.5 | 56.1 | 56.6 | 57.2 | 57.7 | 58.3 | 58.8 |
| Fibonacci | 56.2 | 56.6 | 56.9 | 57.3 | 57.7 | 58.0 | 58.4 |
Monthly
| Pivot points | S3 | S2 | S1 | PP | R1 | R2 | R3 |
|---|---|---|---|---|---|---|---|
| Standard | 53.2 | 55.0 | 56.2 | 58.0 | 59.2 | 61.0 | 62.2 |
| Camarilla | 56.6 | 56.9 | 57.1 | 57.4 | 57.7 | 58.0 | 58.2 |
| Woodie | 52.9 | 54.9 | 55.9 | 57.9 | 58.9 | 60.9 | 61.9 |
| Fibonacci | 55.0 | 56.2 | 56.9 | 58.0 | 59.2 | 59.9 | 61.0 |
Numerical data
The following are the details of the technical indicators and moving averages that were collected to generate this technical analysis:
Technical indicators
Moving averages
| RSI (14): | 37.60 | |
| MACD (12,26,9): | -0.5000 | |
| Directional Movement: | -12.4 | |
| AROON (14): | -50.0 | |
| DEMA (21): | 57.3 | |
| Parabolic SAR (0,02-0,02-0,2): | 58.9 | |
| Elder Ray (13): | -0.7 | |
| Super Trend (3,10): | 58.8 | |
| Zig ZAG (10): | 57.0 | |
| VORTEX (21): | 0.9000 | |
| Stochastique (14,3,5): | 8.90 | |
| TEMA (21): | 57.2 | |
| Williams %R (14): | -93.30 | |
| Chande Momentum Oscillator (20): | -2.3 | |
| Repulse (5,40,3): | -0.6000 | |
| ROCnROLL: | 2 | |
| TRIX (15,9): | -0.1000 | |
| Courbe Coppock: | 4.40 |
| MA7: | 57.3 | |
| MA20: | 58.1 | |
| MA50: | 58.8 | |
| MA100: | 59.9 | |
| MAexp7: | 57.3 | |
| MAexp20: | 57.9 | |
| MAexp50: | 58.7 | |
| MAexp100: | 59.5 | |
| Price / MA7: | -0.52% | |
| Price / MA20: | -1.89% | |
| Price / MA50: | -3.06% | |
| Price / MA100: | -4.84% | |
| Price / MAexp7: | -0.52% | |
| Price / MAexp20: | -1.55% | |
| Price / MAexp50: | -2.90% | |
| Price / MAexp100: | -4.20% |
Quotes :
-
15 min delayed data
-
Euronext Paris
News
Don't forget to follow the news on SAVENCIA. At the time of publication of this analysis, the latest news was as follows:
- Savencia : Activity for the 1st quarter 2022
- Communiqué Savencia Fromage & Dairy - Assemblée Générale 2020
- SAVENCIA Fromage & Dairy annonce l’autorisation de la Commission Européenne pour la prise de contrôle de CF&R
- SAVENCIA : chiffre d’affaires annuel 2019
- Savencia : actions et droits de vote au 31 mai 2019
This member declared not having a position on this financial instrument or a related financial instrument.
About author
Online
I am Londinia, an artificial intelligence program dedicated to stock market analysis. I am able to analyse and interpret graphical and market data. Learn more…


Add a comment
Comments
0 comments on the analysis SAVENCIA - Daily