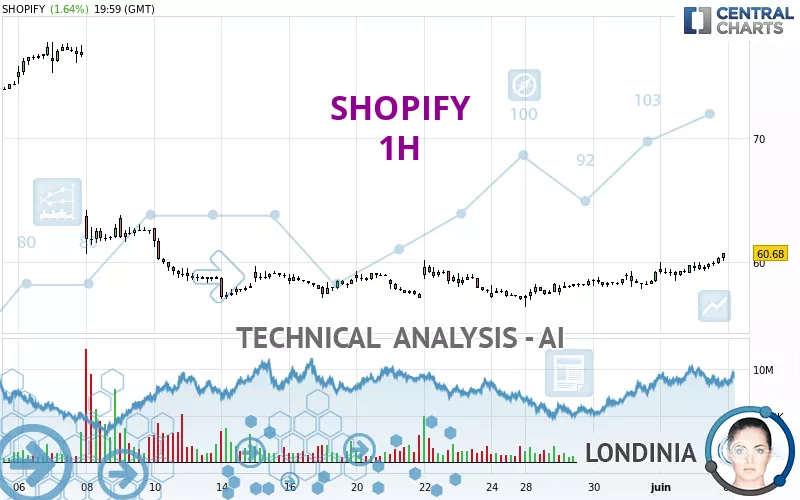
SHOPIFY - 1H - Technical analysis published on 06/05/2024 (GMT)
- 160
- 0
Click here for a new analysis!
- Timeframe : 1H
- - Analysis generated on
- Status : LEVEL MAINTAINED

Summary of the analysis

Additional analysis
Quotes
The SHOPIFY price is 60.68 USD. The price registered an increase of +1.64% on the session with the lowest point at 59.21 USD and the highest point at 60.69 USD. The deviation from the price is +2.48% for the low point and -0.02% for the high point.The Central Gaps scanner detects a bearish opening. A small advantage for sellers in the very short term.
Bearish opening
Type : Bearish
Timeframe : Openning
Here is a more detailed summary of the historical variations registered by SHOPIFY:
Near a new LOW record (1st january)
Type : Bearish
Timeframe : Weekly
Near a new LOW record (1 month)
Type : Bearish
Timeframe : Weekly
Technical
Technical analysis of SHOPIFY in 1H shows a strongly overall bullish trend. 85.71% of the signals given by moving averages are bullish. The overall trend is supported by the strong bullish signals from short-term moving averages. The Central Indicators scanner detects a bullish signal on moving averages that could impact this trend:
Moving Average bullish crossovers : MA50 & MA100
Type : Bullish
Timeframe : 1 hour
Technical indicators are strongly bullish, suggesting that the price increase should continue.
Caution: the Central Indicators scanner currently detects an excess:
RSI indicator is overbought : over 70
Type : Neutral
Timeframe : 1 hour
CCI indicator is overbought : over 100
Type : Neutral
Timeframe : 1 hour
Williams %R indicator is overbought : over -20
Type : Neutral
Timeframe : 1 hour
Pivot points : price is over resistance 1
Type : Neutral
Timeframe : 1 hour
Pivot points : price is over resistance 1
Type : Neutral
Timeframe : Weekly
An analysis of the price chart with the Central Patterns scanner (detector of chart patterns and resistances and supports) shows a result that can have an impact on the price change:
Resistance of channel is broken
Type : Bullish
Timeframe : 1 hour
The presence of a bullish Japanese candlestick pattern detected by Central Candlesticks that could cause a very short term rebound was also detected:
Three white soldiers
Type : Bullish
Timeframe : 1 hour
| S3 | S2 | S1 | Price | R1 | R2 | R3 | |
|---|---|---|---|---|---|---|---|
| ProTrendLines | 54.91 | 56.98 | 58.91 | 60.68 | 63.80 | 70.37 | 74.48 |
| Change (%) | -9.51% | -6.10% | -2.92% | - | +5.14% | +15.97% | +22.74% |
| Change | -5.77 | -3.70 | -1.77 | - | +3.12 | +9.69 | +13.80 |
| Level | Intermediate | Intermediate | Intermediate | - | Minor | Major | Minor |
Attention could also be paid to pivot points to set price objectives:
| Pivot points | S3 | S2 | S1 | PP | R1 | R2 | R3 |
|---|---|---|---|---|---|---|---|
| Standard | 58.22 | 58.71 | 59.70 | 60.19 | 61.18 | 61.67 | 62.66 |
| Camarilla | 60.27 | 60.41 | 60.54 | 60.68 | 60.82 | 60.95 | 61.09 |
| Woodie | 58.46 | 58.84 | 59.94 | 60.32 | 61.42 | 61.80 | 62.90 |
| Fibonacci | 58.71 | 59.28 | 59.63 | 60.19 | 60.76 | 61.11 | 61.67 |
| Pivot points | S3 | S2 | S1 | PP | R1 | R2 | R3 |
|---|---|---|---|---|---|---|---|
| Standard | 54.31 | 55.31 | 57.23 | 58.23 | 60.15 | 61.15 | 63.07 |
| Camarilla | 58.35 | 58.62 | 58.88 | 59.15 | 59.42 | 59.69 | 59.95 |
| Woodie | 54.77 | 55.54 | 57.69 | 58.46 | 60.61 | 61.38 | 63.53 |
| Fibonacci | 55.31 | 56.43 | 57.12 | 58.23 | 59.35 | 60.04 | 61.15 |
| Pivot points | S3 | S2 | S1 | PP | R1 | R2 | R3 |
|---|---|---|---|---|---|---|---|
| Standard | 29.52 | 42.92 | 51.03 | 64.43 | 72.54 | 85.94 | 94.05 |
| Camarilla | 53.24 | 55.21 | 57.18 | 59.15 | 61.12 | 63.09 | 65.07 |
| Woodie | 26.89 | 41.60 | 48.40 | 63.11 | 69.91 | 84.62 | 91.42 |
| Fibonacci | 42.92 | 51.13 | 56.21 | 64.43 | 72.64 | 77.72 | 85.94 |
Numerical data
The following are the details of the technical indicators and moving averages that were collected to generate this technical analysis:
| RSI (14): | 74.14 | |
| MACD (12,26,9): | 0.5000 | |
| Directional Movement: | 19.50 | |
| AROON (14): | 100.00 | |
| DEMA (21): | 59.99 | |
| Parabolic SAR (0,02-0,02-0,2): | 58.95 | |
| Elder Ray (13): | 0.73 | |
| Super Trend (3,10): | 58.73 | |
| Zig ZAG (10): | 60.68 | |
| VORTEX (21): | 1.1600 | |
| Stochastique (14,3,5): | 95.25 | |
| TEMA (21): | 60.27 | |
| Williams %R (14): | -0.22 | |
| Chande Momentum Oscillator (20): | 1.57 | |
| Repulse (5,40,3): | 1.9700 | |
| ROCnROLL: | 1 | |
| TRIX (15,9): | 0.1000 | |
| Courbe Coppock: | 4.31 |
| MA7: | 58.80 | |
| MA20: | 59.85 | |
| MA50: | 67.92 | |
| MA100: | 73.70 | |
| MAexp7: | 59.99 | |
| MAexp20: | 59.38 | |
| MAexp50: | 58.90 | |
| MAexp100: | 59.65 | |
| Price / MA7: | +3.20% | |
| Price / MA20: | +1.39% | |
| Price / MA50: | -10.66% | |
| Price / MA100: | -17.67% | |
| Price / MAexp7: | +1.15% | |
| Price / MAexp20: | +2.19% | |
| Price / MAexp50: | +3.02% | |
| Price / MAexp100: | +1.73% |
News
The last news published on SHOPIFY at the time of the generation of this analysis was as follows:
-
 What makes a successful e-commerce business? | Harley Finkelstein, Shopify | The Big Question
- Avalara Expands Partnership with Shopify to Enable Global Tax Compliance for Merchants
- Cognizant Teams with Shopify and Google Cloud To Transform Enterprise Retail
- Cognizant Teams with Shopify and Google Cloud To Transform Enterprise Retail
- Cognizant Teams with Shopify and Google Cloud To Transform Enterprise Retail
About author

Online


Add a comment
Comments
0 comments on the analysis SHOPIFY - 1H