| Open: | - |
| Change: | - |
| Volume: | - |
| Low: | - |
| High: | - |
| High / Low range: | - |
| Type: | Stocks |
| Ticker: | RACE |
| ISIN: | NL0011585146 |
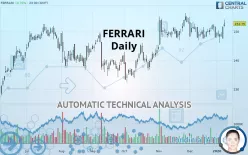
FERRARI - Daily - Technical analysis published on 01/10/2020 (GMT)
- 372
- 0
- 01/10/2020 - 14:31
Click here for a new analysis!
- Timeframe : Daily
- - Analysis generated on 01/10/2020 - 14:31
- Status : TARGET REACHED

Summary of the analysis

Additional analysis
Quotes
The FERRARI rating is 152.75 EUR. The price registered an increase of +0.76% on the session and was traded between 151.65 EUR and 154.05 EUR over the period. The price is currently at +0.73% from its lowest and -0.84% from its highest.The Central Gaps scanner detects a bearish gap which is a sign that the sellers have taken the lead in the very short term.
Opening Gap DOWN
Type : Bearish
Timeframe : Openning
Here is a more detailed summary of the historical variations registered by FERRARI:
Near a new HIGH record (1 year)
Type : Bullish
Timeframe : Weekly
Near a new LOW record (1st january)
Type : Bearish
Timeframe : Weekly
Technical
Technical analysis of FERRARI in Daily shows a strongly overall bullish trend. The signals given by the moving averages are 92.86% bullish. This strong bullish trend is confirmed by the strong signals currently being given by short-term moving averages. The Central Indicators scanner detects a bullish signal on moving averages that could impact this trend:
Bullish price crossover with Moving Average 50
Type : Bullish
Timeframe : Daily
An assessment of technical indicators shows a moderate bullish signal.
Central Indicators, the detector scanner for these technical indicators has recently detected several signals:
Pivot points : price is over resistance 3
Type : Neutral
Timeframe : Daily
Pivot points : price is under support 1
Type : Neutral
Timeframe : Weekly
Price is back over the pivot point
Type : Bullish
Timeframe : Weekly
Momentum indicator is back over 0
Type : Bullish
Timeframe : Daily
The Central Patterns scanner, which studies chart patterns, resistances and supports, has identified these signals:
Near resistance of channel
Type : Bearish
Timeframe : Daily
Resistance of triangle is broken
Type : Bullish
Timeframe : Daily
Central Candlesticks, the scanner specialised in Japanese candlesticks, detects a bullish signal that could support the hypothesis of a small rebound in the very short term:
Bullish harami
Type : Bullish
Timeframe : Daily
| S3 | S2 | S1 | Price | R1 | |
|---|---|---|---|---|---|
| ProTrendLines | 138.00 | 147.69 | 151.30 | 152.75 | 155.10 |
| Change (%) | -9.66% | -3.31% | -0.95% | - | +1.54% |
| Change | -14.75 | -5.06 | -1.45 | - | +2.35 |
| Level | Minor | Major | Major | - | Intermediate |
To determine price objectives, it is also possible to use the pivot points. Here is the price position in relation to pivot points:
| Pivot points | S3 | S2 | S1 | PP | R1 | R2 | R3 |
|---|---|---|---|---|---|---|---|
| Standard | 146.50 | 147.30 | 148.05 | 148.85 | 149.60 | 150.40 | 151.15 |
| Camarilla | 148.37 | 148.52 | 148.66 | 148.80 | 148.94 | 149.08 | 149.23 |
| Woodie | 146.48 | 147.29 | 148.03 | 148.84 | 149.58 | 150.39 | 151.13 |
| Fibonacci | 147.30 | 147.89 | 148.26 | 148.85 | 149.44 | 149.81 | 150.40 |
| Pivot points | S3 | S2 | S1 | PP | R1 | R2 | R3 |
|---|---|---|---|---|---|---|---|
| Standard | 148.33 | 149.27 | 150.63 | 151.57 | 152.93 | 153.87 | 155.23 |
| Camarilla | 151.37 | 151.58 | 151.79 | 152.00 | 152.21 | 152.42 | 152.63 |
| Woodie | 148.55 | 149.38 | 150.85 | 151.68 | 153.15 | 153.98 | 155.45 |
| Fibonacci | 149.27 | 150.15 | 150.69 | 151.57 | 152.45 | 152.99 | 153.87 |
| Pivot points | S3 | S2 | S1 | PP | R1 | R2 | R3 |
|---|---|---|---|---|---|---|---|
| Standard | 136.72 | 141.83 | 144.87 | 149.98 | 153.02 | 158.13 | 161.17 |
| Camarilla | 145.66 | 146.41 | 147.15 | 147.90 | 148.65 | 149.39 | 150.14 |
| Woodie | 135.68 | 141.31 | 143.83 | 149.46 | 151.98 | 157.61 | 160.13 |
| Fibonacci | 141.83 | 144.95 | 146.87 | 149.98 | 153.10 | 155.02 | 158.13 |
Numerical data
The following are the details of the technical indicators and moving averages that were collected to generate this technical analysis:
| RSI (14): | 55.71 | |
| MACD (12,26,9): | 0.2100 | |
| Directional Movement: | -2.86 | |
| AROON (14): | -28.57 | |
| DEMA (21): | 150.20 | |
| Parabolic SAR (0,02-0,02-0,2): | 146.00 | |
| Elder Ray (13): | -0.29 | |
| Super Trend (3,10): | 146.91 | |
| Zig ZAG (10): | 151.60 | |
| VORTEX (21): | 0.9500 | |
| Stochastique (14,3,5): | 54.36 | |
| TEMA (21): | 149.49 | |
| Williams %R (14): | -13.85 | |
| Chande Momentum Oscillator (20): | 3.45 | |
| Repulse (5,40,3): | 3.6400 | |
| ROCnROLL: | 1 | |
| TRIX (15,9): | 0.0200 | |
| Courbe Coppock: | 0.61 |
| MA7: | 149.65 | |
| MA20: | 149.66 | |
| MA50: | 149.06 | |
| MA100: | 144.60 | |
| MAexp7: | 149.85 | |
| MAexp20: | 149.80 | |
| MAexp50: | 148.35 | |
| MAexp100: | 145.12 | |
| Price / MA7: | +2.07% | |
| Price / MA20: | +2.06% | |
| Price / MA50: | +2.48% | |
| Price / MA100: | +5.64% | |
| Price / MAexp7: | +1.94% | |
| Price / MAexp20: | +1.97% | |
| Price / MAexp50: | +2.97% | |
| Price / MAexp100: | +5.26% |
News
The latest news and videos published on FERRARI at the time of the analysis were as follows:
- 12/23/2019 - 18:06 Ferrari N.V.: periodic report on the buyback program
- 12/16/2019 - 09:46 Ferrari N.V.: periodic report on the buyback program
- 12/11/2019 - 23:39 Ferrari N.V. signs a new syndicated revolving credit facility
- 12/09/2019 - 14:21 Ferrari N.V.: informativa periodica sull’acquisto di azioni proprie
- 12/02/2019 - 18:18 Ferrari N.V.: informativa periodica sull’acquisto di azioni proprie
About author

Online


Add a comment
Comments
0 comments on the analysis FERRARI - Daily