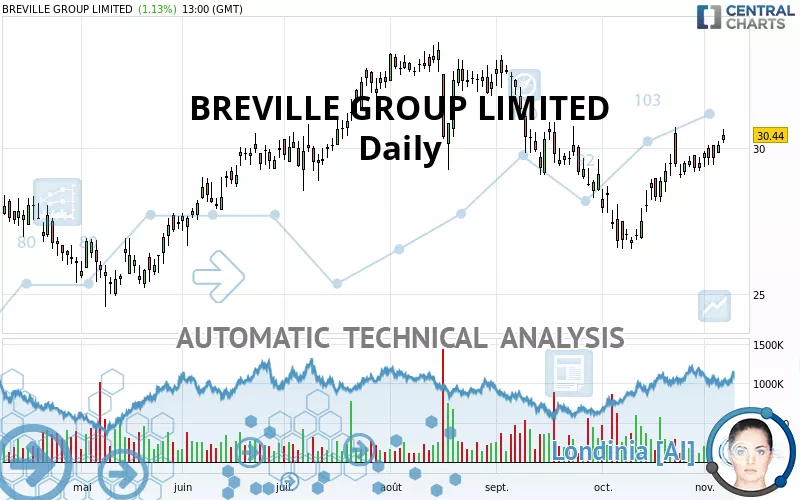
BREVILLE GROUP LIMITED - Daily - Technical analysis published on 11/06/2021 (GMT)
- 144
- 0
Click here for a new analysis!
- Timeframe : Daily
- - Analysis generated on
- Status : INVALID
Summary of the analysis

Additional analysis
Quotes
BREVILLE GROUP LIMITED rating 30.440 AUD. The price registered an increase of +1.13% on the session and was traded between 30.140 AUD and 30.620 AUD over the period. The price is currently at +1.00% from its lowest and -0.59% from its highest.The Central Gaps scanner detects a bullish opening. A small advantage for buyers in the very short term.
Bullish opening
Type : Bullish
Timeframe : Openning
A study of price movements over other periods shows the following variations:
Near a new HIGH record (1 month)
Type : Bullish
Timeframe : Weekly
Technical
Technical analysis of this Daily chart of BREVILLE GROUP LIMITED indicates that the overall trend is bullish. 64.29% of the signals given by moving averages are bullish. The overall trend is reinforced by the strong bullish signals from short-term moving averages. The Central Indicators market scanner is currently detecting several bullish signals that could impact this trend:
Bullish price crossover with adaptative moving average 50
Type : Bullish
Timeframe : Daily
Bullish price crossover with adaptative moving average 100
Type : Bullish
Timeframe : Daily
Technical indicators are strongly bullish, suggesting that the price increase should continue.
Central Indicators, the detector scanner for these technical indicators has recently detected several signals:
Pivot points : price is over resistance 1
Type : Neutral
Timeframe : Daily
Pivot points : price is over resistance 1
Type : Neutral
Timeframe : Weekly
Price is back under the pivot point
Type : Bearish
Timeframe : Daily
The analysis of the price chart with Central Patterns scanners does not return any result.
The Central Candlesticks scanner which studies Japanese candlesticks did not detect anything.
| S3 | S2 | S1 | Price | R1 | R2 | R3 | |
|---|---|---|---|---|---|---|---|
| ProTrendLines | 26.808 | 28.047 | 29.320 | 30.440 | 31.350 | 32.673 | 33.350 |
| Change (%) | -11.93% | -7.86% | -3.68% | - | +2.99% | +7.34% | +9.56% |
| Change | -3.632 | -2.393 | -1.120 | - | +0.910 | +2.233 | +2.910 |
| Level | Intermediate | Intermediate | Intermediate | - | Major | Intermediate | Major |
Pivot points can also be used to set your price objectives. Here is the price situation in relation to pivot points:
| Pivot points | S3 | S2 | S1 | PP | R1 | R2 | R3 |
|---|---|---|---|---|---|---|---|
| Standard | 29.700 | 29.920 | 30.180 | 30.400 | 30.660 | 30.880 | 31.140 |
| Camarilla | 30.308 | 30.352 | 30.396 | 30.440 | 30.484 | 30.528 | 30.572 |
| Woodie | 29.720 | 29.930 | 30.200 | 30.410 | 30.680 | 30.890 | 31.160 |
| Fibonacci | 29.920 | 30.103 | 30.217 | 30.400 | 30.583 | 30.697 | 30.880 |
| Pivot points | S3 | S2 | S1 | PP | R1 | R2 | R3 |
|---|---|---|---|---|---|---|---|
| Standard | 28.367 | 28.853 | 29.647 | 30.133 | 30.927 | 31.413 | 32.207 |
| Camarilla | 30.088 | 30.205 | 30.323 | 30.440 | 30.557 | 30.675 | 30.792 |
| Woodie | 28.520 | 28.930 | 29.800 | 30.210 | 31.080 | 31.490 | 32.360 |
| Fibonacci | 28.853 | 29.342 | 29.644 | 30.133 | 30.622 | 30.924 | 31.413 |
| Pivot points | S3 | S2 | S1 | PP | R1 | R2 | R3 |
|---|---|---|---|---|---|---|---|
| Standard | 22.840 | 24.690 | 27.000 | 28.850 | 31.160 | 33.010 | 35.320 |
| Camarilla | 28.166 | 28.547 | 28.929 | 29.310 | 29.691 | 30.073 | 30.454 |
| Woodie | 23.070 | 24.805 | 27.230 | 28.965 | 31.390 | 33.125 | 35.550 |
| Fibonacci | 24.690 | 26.279 | 27.261 | 28.850 | 30.439 | 31.421 | 33.010 |
Numerical data
The following is the status of technical indicators and moving averages registered at the time this technical analysis was created:
| RSI (14): | 60.97 | |
| MACD (12,26,9): | 0.2070 | |
| Directional Movement: | 11.580 | |
| AROON (14): | 21.428 | |
| DEMA (21): | 29.349 | |
| Parabolic SAR (0,02-0,02-0,2): | 29.410 | |
| Elder Ray (13): | 0.650 | |
| Super Trend (3,10): | 27.935 | |
| Zig ZAG (10): | 30.100 | |
| VORTEX (21): | 1.1690 | |
| Stochastique (14,3,5): | 66.65 | |
| TEMA (21): | 29.920 | |
| Williams %R (14): | -23.44 | |
| Chande Momentum Oscillator (20): | 1.250 | |
| Repulse (5,40,3): | -0.5930 | |
| ROCnROLL: | 1 | |
| TRIX (15,9): | -0.0040 | |
| Courbe Coppock: | 12.69 |
| MA7: | 29.627 | |
| MA20: | 28.813 | |
| MA50: | 29.564 | |
| MA100: | 30.397 | |
| MAexp7: | 29.652 | |
| MAexp20: | 29.223 | |
| MAexp50: | 29.465 | |
| MAexp100: | 29.559 | |
| Price / MA7: | +2.74% | |
| Price / MA20: | +5.65% | |
| Price / MA50: | +2.96% | |
| Price / MA100: | +0.14% | |
| Price / MAexp7: | +2.66% | |
| Price / MAexp20: | +4.16% | |
| Price / MAexp50: | +3.31% | |
| Price / MAexp100: | +2.98% |
News
The last news published on BREVILLE GROUP LIMITED at the time of the generation of this analysis was as follows:
About author

Online


Add a comment
Comments
0 comments on the analysis BREVILLE GROUP LIMITED - Daily