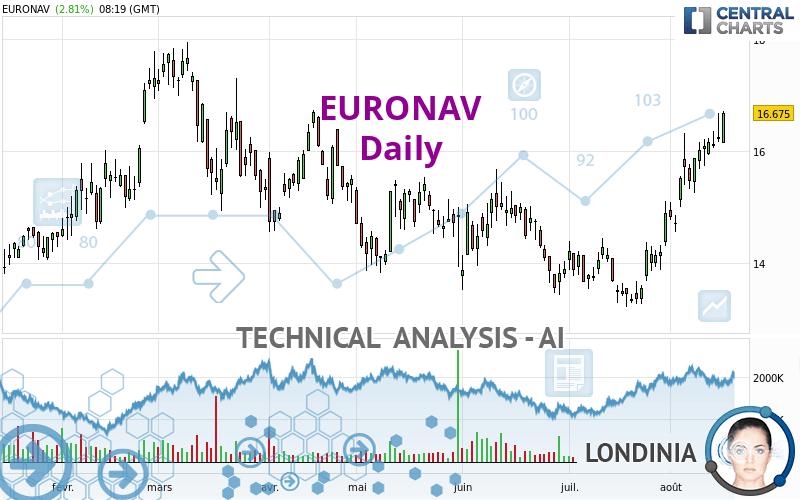
CMB.TECH - Daily - Technical analysis published on 08/16/2023 (GMT)
- 149
- 0
Click here for a new analysis!
- Timeframe : Daily
- - Analysis generated on
- Status : INVALID

Summary of the analysis

Additional analysis
Quotes
EURONAV rating 16.675 EUR. The price has increased by +2.81% since the last closing with the lowest point at 16.140 EUR and the highest point at 16.715 EUR. The deviation from the price is +3.31% for the low point and -0.24% for the high point.A bearish gap was detected at the opening by the Central Gaps scanner. There are a lot of sellers and they have the upper hand in the very short term.
Opening Gap DOWN
Type : Bearish
Timeframe : Openning
Here is a more detailed summary of the historical variations registered by EURONAV:
Near a new HIGH record (1st january)
Type : Bullish
Timeframe : Weekly
Near a new HIGH record (1 month)
Type : Bullish
Timeframe : Weekly
Technical
Technical analysis of this Daily chart of EURONAV indicates that the overall trend is strongly bullish. 92.86% of the signals given by moving averages are bullish. The overall trend is supported by the strong bullish signals from short-term moving averages. There is no crossing of moving average by the price or crossing of moving averages between themselves.
In fact, 17 technical indicators on 18 studied are currently positioned bullish. Caution: the Central Indicators scanner currently detects an excess:
RSI indicator is overbought : over 70
Type : Neutral
Timeframe : Daily
CCI indicator is overbought : over 100
Type : Neutral
Timeframe : Daily
CCI indicator: bearish divergence
Type : Bearish
Timeframe : Daily
Williams %R indicator is overbought : over -20
Type : Neutral
Timeframe : Daily
Pivot points : price is over resistance 1
Type : Neutral
Timeframe : Daily
Pivot points : price is over resistance 1
Type : Neutral
Timeframe : Weekly
Central Patterns, the market scanner focusing on chart patterns, resistances and supports found these results:
Near horizontal resistance
Type : Bearish
Timeframe : Daily
Resistance of channel is broken
Type : Bullish
Timeframe : Daily
The presence of a bullish Japanese candlestick pattern detected by Central Candlesticks that could cause a very short term rebound was also detected:
Bullish engulfing lines
Type : Bullish
Timeframe : Daily
| S3 | S2 | S1 | Price | R1 | R2 | R3 | |
|---|---|---|---|---|---|---|---|
| ProTrendLines | 14.269 | 15.140 | 15.756 | 16.675 | 16.816 | 17.374 | 19.521 |
| Change (%) | -14.43% | -9.21% | -5.51% | - | +0.85% | +4.19% | +17.07% |
| Change | -2.406 | -1.535 | -0.919 | - | +0.141 | +0.699 | +2.846 |
| Level | Intermediate | Major | Minor | - | Intermediate | Major | Intermediate |
Pivot points can also be used to set your price objectives. Here is the price situation in relation to pivot points:
| Pivot points | S3 | S2 | S1 | PP | R1 | R2 | R3 |
|---|---|---|---|---|---|---|---|
| Standard | 15.515 | 15.840 | 16.030 | 16.355 | 16.545 | 16.870 | 17.060 |
| Camarilla | 16.078 | 16.126 | 16.173 | 16.220 | 16.267 | 16.314 | 16.362 |
| Woodie | 15.448 | 15.806 | 15.963 | 16.321 | 16.478 | 16.836 | 16.993 |
| Fibonacci | 15.840 | 16.037 | 16.158 | 16.355 | 16.552 | 16.673 | 16.870 |
| Pivot points | S3 | S2 | S1 | PP | R1 | R2 | R3 |
|---|---|---|---|---|---|---|---|
| Standard | 14.550 | 14.900 | 15.530 | 15.880 | 16.510 | 16.860 | 17.490 |
| Camarilla | 15.891 | 15.980 | 16.070 | 16.160 | 16.250 | 16.340 | 16.430 |
| Woodie | 14.690 | 14.970 | 15.670 | 15.950 | 16.650 | 16.930 | 17.630 |
| Fibonacci | 14.900 | 15.274 | 15.506 | 15.880 | 16.254 | 16.486 | 16.860 |
| Pivot points | S3 | S2 | S1 | PP | R1 | R2 | R3 |
|---|---|---|---|---|---|---|---|
| Standard | 11.827 | 12.523 | 13.707 | 14.403 | 15.587 | 16.283 | 17.467 |
| Camarilla | 14.373 | 14.545 | 14.718 | 14.890 | 15.062 | 15.235 | 15.407 |
| Woodie | 12.070 | 12.645 | 13.950 | 14.525 | 15.830 | 16.405 | 17.710 |
| Fibonacci | 12.523 | 13.242 | 13.685 | 14.403 | 15.122 | 15.565 | 16.283 |
Numerical data
The following is the status of the technical indicators and moving averages at the time of publication of this technical analysis:
| RSI (14): | 75.99 | |
| MACD (12,26,9): | 0.6320 | |
| Directional Movement: | 28.274 | |
| AROON (14): | 92.857 | |
| DEMA (21): | 16.108 | |
| Parabolic SAR (0,02-0,02-0,2): | 15.078 | |
| Elder Ray (13): | 0.711 | |
| Super Trend (3,10): | 14.979 | |
| Zig ZAG (10): | 16.675 | |
| VORTEX (21): | 1.2090 | |
| Stochastique (14,3,5): | 91.09 | |
| TEMA (21): | 16.535 | |
| Williams %R (14): | -1.41 | |
| Chande Momentum Oscillator (20): | 1.785 | |
| Repulse (5,40,3): | 4.0620 | |
| ROCnROLL: | 1 | |
| TRIX (15,9): | 0.4800 | |
| Courbe Coppock: | 30.58 |
| MA7: | 16.167 | |
| MA20: | 15.054 | |
| MA50: | 14.568 | |
| MA100: | 14.048 | |
| MAexp7: | 16.127 | |
| MAexp20: | 15.359 | |
| MAexp50: | 14.678 | |
| MAexp100: | 14.375 | |
| Price / MA7: | +3.14% | |
| Price / MA20: | +10.77% | |
| Price / MA50: | +14.46% | |
| Price / MA100: | +18.70% | |
| Price / MAexp7: | +3.40% | |
| Price / MAexp20: | +8.57% | |
| Price / MAexp50: | +13.61% | |
| Price / MAexp100: | +16.00% |
News
The last news published on EURONAV at the time of the generation of this analysis was as follows:
- EURN Stock Alert: Halper Sadeh LLP Is Investigating Whether the Sale of Euronav NV Is Fair to Shareholders
- International Seaways Monetizes FSO Joint Venture With Sale to Euronav and Increases Quarterly Cash Dividend
- Euronav announces fourth quarter 2019 results
- Euronav announces second quarter and first half 2019 results
- Euronav announces second quarter and half year results 2018
About author
Online


Add a comment
Comments
0 comments on the analysis CMB.TECH - Daily