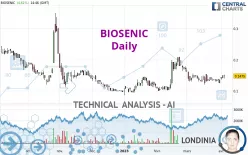
BIOSENIC - Daily - Technical analysis published on 04/06/2023 (GMT)
- 174
- 0
Click here for a new analysis!
- Timeframe : Daily
- - Analysis generated on
- Status : INVALID

Summary of the analysis

Additional analysis
Quotes
BIOSENIC rating 0.1475 EUR. The price registered an increase of +4.61% on the session and was traded between 0.1400 EUR and 0.1520 EUR over the period. The price is currently at +5.36% from its lowest and -2.96% from its highest.Here is a more detailed summary of the historical variations registered by BIOSENIC:
Near a new HIGH record (1 month)
Type : Bullish
Timeframe : Weekly
Technical
A technical analysis in Daily of this BIOSENIC chart shows a bullish trend. 78.57% of the signals given by moving averages are bullish. The overall trend seems to be showing some signs of weakness, as do the tentative bullish signals given by short-term moving averages. There is no crossing of moving average by the price or crossing of moving averages between themselves.
The technical indicators are bullish. There is still some doubt about the price increase.
Caution: the Central Indicators scanner currently detects an excess:
CCI indicator is overbought : over 100
Type : Neutral
Timeframe : Daily
Williams %R indicator is overbought : over -20
Type : Neutral
Timeframe : Daily
Pivot points : price is over resistance 1
Type : Neutral
Timeframe : Daily
Pivot points : price is over resistance 2
Type : Neutral
Timeframe : Weekly
Central Patterns, the market scanner focusing on chart patterns, resistances and supports found these results:
Near resistance of channel
Type : Bearish
Timeframe : Daily
Near resistance of triangle
Type : Bearish
Timeframe : Daily
The Central Candlesticks scanner which studies Japanese candlesticks did not detect anything.
| S3 | S2 | S1 | Price | R1 | R2 | R3 | |
|---|---|---|---|---|---|---|---|
| ProTrendLines | 0.1041 | 0.1251 | 0.1443 | 0.1475 | 0.1640 | 0.2075 | 0.2432 |
| Change (%) | -29.42% | -15.19% | -2.17% | - | +11.19% | +40.68% | +64.88% |
| Change | -0.0434 | -0.0224 | -0.0032 | - | +0.0165 | +0.0600 | +0.0957 |
| Level | Major | Intermediate | Minor | - | Minor | Intermediate | Minor |
To determine price objectives, it is also possible to use the pivot points. Here is the price position in relation to pivot points:
| Pivot points | S3 | S2 | S1 | PP | R1 | R2 | R3 |
|---|---|---|---|---|---|---|---|
| Standard | 0.1290 | 0.1345 | 0.1410 | 0.1465 | 0.1530 | 0.1585 | 0.1650 |
| Camarilla | 0.1442 | 0.1453 | 0.1464 | 0.1475 | 0.1486 | 0.1497 | 0.1508 |
| Woodie | 0.1295 | 0.1348 | 0.1415 | 0.1468 | 0.1535 | 0.1588 | 0.1655 |
| Fibonacci | 0.1345 | 0.1391 | 0.1419 | 0.1465 | 0.1511 | 0.1539 | 0.1585 |
| Pivot points | S3 | S2 | S1 | PP | R1 | R2 | R3 |
|---|---|---|---|---|---|---|---|
| Standard | 0.1164 | 0.1208 | 0.1286 | 0.1330 | 0.1408 | 0.1452 | 0.1530 |
| Camarilla | 0.1331 | 0.1342 | 0.1353 | 0.1364 | 0.1375 | 0.1386 | 0.1398 |
| Woodie | 0.1181 | 0.1217 | 0.1303 | 0.1339 | 0.1425 | 0.1461 | 0.1547 |
| Fibonacci | 0.1208 | 0.1255 | 0.1283 | 0.1330 | 0.1377 | 0.1405 | 0.1452 |
| Pivot points | S3 | S2 | S1 | PP | R1 | R2 | R3 |
|---|---|---|---|---|---|---|---|
| Standard | 0.0581 | 0.0891 | 0.1127 | 0.1437 | 0.1673 | 0.1983 | 0.2219 |
| Camarilla | 0.1214 | 0.1264 | 0.1314 | 0.1364 | 0.1414 | 0.1464 | 0.1514 |
| Woodie | 0.0545 | 0.0873 | 0.1091 | 0.1419 | 0.1637 | 0.1965 | 0.2183 |
| Fibonacci | 0.0891 | 0.1099 | 0.1228 | 0.1437 | 0.1645 | 0.1774 | 0.1983 |
Numerical data
The following is the status of the technical indicators and moving averages at the time of publication of this technical analysis:
| RSI (14): | 55.55 | |
| MACD (12,26,9): | -0.0007 | |
| Directional Movement: | 3.1954 | |
| AROON (14): | 7.1428 | |
| DEMA (21): | 0.1382 | |
| Parabolic SAR (0,02-0,02-0,2): | 0.1217 | |
| Elder Ray (13): | 0.0070 | |
| Super Trend (3,10): | 0.1691 | |
| Zig ZAG (10): | 0.1475 | |
| VORTEX (21): | 0.9551 | |
| Stochastique (14,3,5): | 67.55 | |
| TEMA (21): | 0.1367 | |
| Williams %R (14): | -18.64 | |
| Chande Momentum Oscillator (20): | 0.0161 | |
| Repulse (5,40,3): | -1.7558 | |
| ROCnROLL: | 1 | |
| TRIX (15,9): | -0.2528 | |
| Courbe Coppock: | 4.56 |
| MA7: | 0.1387 | |
| MA20: | 0.1366 | |
| MA50: | 0.1402 | |
| MA100: | 0.1322 | |
| MAexp7: | 0.1402 | |
| MAexp20: | 0.1394 | |
| MAexp50: | 0.1393 | |
| MAexp100: | 0.1469 | |
| Price / MA7: | +6.34% | |
| Price / MA20: | +7.98% | |
| Price / MA50: | +5.21% | |
| Price / MA100: | +11.57% | |
| Price / MAexp7: | +5.21% | |
| Price / MAexp20: | +5.81% | |
| Price / MAexp50: | +5.89% | |
| Price / MAexp100: | +0.41% |
News
The latest news and videos published on BIOSENIC at the time of the analysis were as follows:
- BioSenic appoints Lieven Huysse, MD, as Chief Medical Officer
- BioSenic provides Financial Update and Financial Calendar 2023
- BioSenic publishes new data on the mechanism of action of arsenic trioxide (ATO)
- BioSenic delivers a new post-hoc analysis of its Phase III JTA-004 trial on knee osteo-arthritis with positive action on the most severely affected patient population
- BioSenic SA: Information on the total number of voting rights and shares
About author
Online


Add a comment
Comments
0 comments on the analysis BIOSENIC - Daily