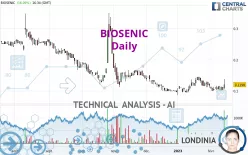
BIOSENIC - Daily - Technical analysis published on 02/15/2023 (GMT)
- 162
- 0
Click here for a new analysis!
- Timeframe : Daily
- - Analysis generated on
- Status : INVALID

Summary of the analysis

Additional analysis
Quotes
BIOSENIC rating 0.1198 EUR. The price has increased by +16.09% since the last closing with the lowest point at 0.1052 EUR and the highest point at 0.1380 EUR. The deviation from the price is +13.88% for the low point and -13.19% for the high point.The Central Gaps scanner detects a bullish opening. A small advantage for buyers in the very short term.
Bullish opening
Type : Bullish
Timeframe : Openning
A study of price movements over other periods shows the following variations:
Near a new LOW record (1 month)
Type : Bearish
Timeframe : Weekly
The Central Volumes scanner detects abnormal volumes on the asset:
Abnormal volumes
Timeframe : 5 days
Technical
Technical analysis of BIOSENIC in Daily shows an overall bearish trend. 67.86% of the signals given by moving averages are bearish. Caution: the slightly bullish signals currently given by short-term moving averages show a possible weakening of the global trend. An assessment of moving averages reveals several bullish signals that could impact this trend:
Bullish price crossover with Moving Average 20
Type : Bullish
Timeframe : Daily
Bullish price crossover with Moving Average 50
Type : Bullish
Timeframe : Daily
Bullish price crossover with adaptative moving average 20
Type : Bullish
Timeframe : Daily
In fact, of the 18 technical indicators analysed by Central Analyzer, 7 are bullish, 7 are neutral and 4 are bearish. Caution: the Central Indicators scanner currently detects an excess:
MACD indicator: bullish divergence
Type : Bullish
Timeframe : Daily
Pivot points : price is over resistance 1
Type : Neutral
Timeframe : Weekly
Pivot points : price is over resistance 3
Type : Neutral
Timeframe : Daily
RSI indicator is back over 50
Type : Bullish
Timeframe : Daily
Parabolic SAR indicator bullish reversal
Type : Bullish
Timeframe : Daily
Aroon indicator bullish trend
Type : Bullish
Timeframe : Daily
Williams %R indicator is back over -50
Type : Bullish
Timeframe : Daily
The Central Patterns scanner, which studies chart patterns, resistances and supports, has identified this signal:
Near resistance of channel
Type : Bearish
Timeframe : Daily
The Central Candlesticks scanner, specialised in Japanese candlesticks, did not identify any signals.
| S2 | S1 | Price | R1 | R2 | R3 | |
|---|---|---|---|---|---|---|
| ProTrendLines | 0.0979 | 0.1147 | 0.1198 | 0.1442 | 0.2423 | 0.2720 |
| Change (%) | -18.28% | -4.26% | - | +20.37% | +102.25% | +127.05% |
| Change | -0.0219 | -0.0051 | - | +0.0244 | +0.1225 | +0.1522 |
| Level | Major | Minor | - | Minor | Intermediate | Minor |
Pivot points can also be used to set your price objectives. Here is the price situation in relation to pivot points:
| Pivot points | S3 | S2 | S1 | PP | R1 | R2 | R3 |
|---|---|---|---|---|---|---|---|
| Standard | 0.0712 | 0.0882 | 0.1040 | 0.1210 | 0.1368 | 0.1538 | 0.1696 |
| Camarilla | 0.1108 | 0.1138 | 0.1168 | 0.1198 | 0.1228 | 0.1258 | 0.1288 |
| Woodie | 0.0706 | 0.0879 | 0.1034 | 0.1207 | 0.1362 | 0.1535 | 0.1690 |
| Fibonacci | 0.0882 | 0.1007 | 0.1085 | 0.1210 | 0.1335 | 0.1413 | 0.1538 |
| Pivot points | S3 | S2 | S1 | PP | R1 | R2 | R3 |
|---|---|---|---|---|---|---|---|
| Standard | 0.0900 | 0.0960 | 0.1040 | 0.1100 | 0.1180 | 0.1240 | 0.1320 |
| Camarilla | 0.1082 | 0.1094 | 0.1107 | 0.1120 | 0.1133 | 0.1146 | 0.1159 |
| Woodie | 0.0910 | 0.0965 | 0.1050 | 0.1105 | 0.1190 | 0.1245 | 0.1330 |
| Fibonacci | 0.0960 | 0.1014 | 0.1047 | 0.1100 | 0.1154 | 0.1187 | 0.1240 |
| Pivot points | S3 | S2 | S1 | PP | R1 | R2 | R3 |
|---|---|---|---|---|---|---|---|
| Standard | 0.0283 | 0.0573 | 0.0871 | 0.1161 | 0.1459 | 0.1749 | 0.2047 |
| Camarilla | 0.1008 | 0.1062 | 0.1116 | 0.1170 | 0.1224 | 0.1278 | 0.1332 |
| Woodie | 0.0288 | 0.0575 | 0.0876 | 0.1163 | 0.1464 | 0.1751 | 0.2052 |
| Fibonacci | 0.0573 | 0.0797 | 0.0936 | 0.1161 | 0.1385 | 0.1524 | 0.1749 |
Numerical data
The following is the status of technical indicators and moving averages registered at the time this technical analysis was created:
| RSI (14): | 52.96 | |
| MACD (12,26,9): | -0.0021 | |
| Directional Movement: | 11.0659 | |
| AROON (14): | 57.1429 | |
| DEMA (21): | 0.1111 | |
| Parabolic SAR (0,02-0,02-0,2): | 0.1000 | |
| Elder Ray (13): | 0.0089 | |
| Super Trend (3,10): | 0.0996 | |
| Zig ZAG (10): | 0.1198 | |
| VORTEX (21): | 0.9377 | |
| Stochastique (14,3,5): | 32.72 | |
| TEMA (21): | 0.1117 | |
| Williams %R (14): | -47.89 | |
| Chande Momentum Oscillator (20): | -0.0060 | |
| Repulse (5,40,3): | 1.7452 | |
| ROCnROLL: | -1 | |
| TRIX (15,9): | -0.1729 | |
| Courbe Coppock: | 23.61 |
| MA7: | 0.1108 | |
| MA20: | 0.1178 | |
| MA50: | 0.1137 | |
| MA100: | 0.1395 | |
| MAexp7: | 0.1119 | |
| MAexp20: | 0.1137 | |
| MAexp50: | 0.1215 | |
| MAexp100: | 0.1470 | |
| Price / MA7: | +8.12% | |
| Price / MA20: | +1.70% | |
| Price / MA50: | +5.36% | |
| Price / MA100: | -14.12% | |
| Price / MAexp7: | +7.06% | |
| Price / MAexp20: | +5.36% | |
| Price / MAexp50: | -1.40% | |
| Price / MAexp100: | -18.50% |
News
The last news published on BIOSENIC at the time of the generation of this analysis was as follows:
- BioSenic announces initiation of coverage by Portzamparc and Gilbert Dupont
- BioSenic appoints Dr Carole Nicco as Chief Scientific Officer
- BioSenic SA : Information on the total number of voting rights and shares
- BioSenic appoints Michel Wurm, M.D. as Chief Medical Officer
- BioSenic SA provides update on its autoimmune disease platform based on ATO (arsenic trioxide)
About author
Online


Add a comment
Comments
0 comments on the analysis BIOSENIC - Daily