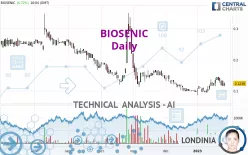
BIOSENIC - Daily - Technical analysis published on 01/27/2023 (GMT)
- 167
- 0
Click here for a new analysis!
- Timeframe : Daily
- - Analysis generated on
- Status : TARGET REACHED

Summary of the analysis

Additional analysis
Quotes
The BIOSENIC rating is 0.1238 EUR. The price registered an increase of +6.72% on the session and was traded between 0.1150 EUR and 0.1278 EUR over the period. The price is currently at +7.65% from its lowest and -3.13% from its highest.The Central Gaps scanner detects a bullish opening marking the presence of buyers ahead of sellers at the opening but not sufficiently marked to allow the price to register a quotation gap.
Bullish opening
Type : Bullish
Timeframe : Openning
So that you have an overall view of the price change, here is a table showing the variations over several periods:
Technical
Technical analysis of BIOSENIC in Daily shows an overall bearish trend. 67.86% of the signals given by moving averages are bearish. Caution: the slightly bullish signals currently given by short-term moving averages show a possible weakening of the global trend. The Central Indicators scanner detects a bullish signal on moving averages that could impact this trend:
Bullish price crossover with Moving Average 50
Type : Bullish
Timeframe : Daily
In fact, only 9 technical indicators out of 18 studied are currently bullish. Central Indicators, the scanner specialised in technical indicators, has identified these signals:
RSI indicator is back over 50
Type : Bullish
Timeframe : Daily
Price is back over the pivot point
Type : Bullish
Timeframe : Daily
Price is back under the pivot point
Type : Bearish
Timeframe : Weekly
Williams %R indicator is back over -50
Type : Bullish
Timeframe : Daily
Central Patterns, the scanner specializing in chart patterns, did not identify any signals.
For a small rebound in the very short term, the Central Candlesticks scanner currently notes the presence of this bullish pattern in Japanese candlesticks:
Bullish harami
Type : Bullish
Timeframe : Daily
| S2 | S1 | Price | R1 | R2 | R3 | |
|---|---|---|---|---|---|---|
| ProTrendLines | 0.0953 | 0.1200 | 0.1238 | 0.1640 | 0.2423 | 0.2965 |
| Change (%) | -23.02% | -3.07% | - | +32.47% | +95.72% | +139.50% |
| Change | -0.0285 | -0.0038 | - | +0.0402 | +0.1185 | +0.1727 |
| Level | Minor | Major | - | Minor | Intermediate | Major |
Pivot points can also be used to set your price objectives. Here is the price situation in relation to pivot points:
| Pivot points | S3 | S2 | S1 | PP | R1 | R2 | R3 |
|---|---|---|---|---|---|---|---|
| Standard | 0.1038 | 0.1094 | 0.1166 | 0.1222 | 0.1294 | 0.1350 | 0.1422 |
| Camarilla | 0.1203 | 0.1215 | 0.1226 | 0.1238 | 0.1250 | 0.1262 | 0.1273 |
| Woodie | 0.1046 | 0.1098 | 0.1174 | 0.1226 | 0.1302 | 0.1354 | 0.1430 |
| Fibonacci | 0.1094 | 0.1143 | 0.1173 | 0.1222 | 0.1271 | 0.1301 | 0.1350 |
| Pivot points | S3 | S2 | S1 | PP | R1 | R2 | R3 |
|---|---|---|---|---|---|---|---|
| Standard | 0.0878 | 0.1014 | 0.1178 | 0.1314 | 0.1478 | 0.1614 | 0.1778 |
| Camarilla | 0.1260 | 0.1287 | 0.1315 | 0.1342 | 0.1370 | 0.1397 | 0.1425 |
| Woodie | 0.0892 | 0.1021 | 0.1192 | 0.1321 | 0.1492 | 0.1621 | 0.1792 |
| Fibonacci | 0.1014 | 0.1129 | 0.1199 | 0.1314 | 0.1429 | 0.1499 | 0.1614 |
| Pivot points | S3 | S2 | S1 | PP | R1 | R2 | R3 |
|---|---|---|---|---|---|---|---|
| Standard | 0.0235 | 0.0596 | 0.0778 | 0.1139 | 0.1321 | 0.1682 | 0.1864 |
| Camarilla | 0.0811 | 0.0861 | 0.0910 | 0.0960 | 0.1010 | 0.1060 | 0.1109 |
| Woodie | 0.0146 | 0.0551 | 0.0689 | 0.1094 | 0.1232 | 0.1637 | 0.1775 |
| Fibonacci | 0.0596 | 0.0803 | 0.0932 | 0.1139 | 0.1346 | 0.1475 | 0.1682 |
Numerical data
The following is the status of technical indicators and moving averages registered at the time this technical analysis was created:
| RSI (14): | 51.99 | |
| MACD (12,26,9): | 0.0022 | |
| Directional Movement: | 1.0448 | |
| AROON (14): | 64.2857 | |
| DEMA (21): | 0.1216 | |
| Parabolic SAR (0,02-0,02-0,2): | 0.1433 | |
| Elder Ray (13): | -0.0007 | |
| Super Trend (3,10): | 0.0996 | |
| Zig ZAG (10): | 0.1238 | |
| VORTEX (21): | 1.0017 | |
| Stochastique (14,3,5): | 48.53 | |
| TEMA (21): | 0.1296 | |
| Williams %R (14): | -42.40 | |
| Chande Momentum Oscillator (20): | 0.0287 | |
| Repulse (5,40,3): | -14.7584 | |
| ROCnROLL: | -1 | |
| TRIX (15,9): | 0.0941 | |
| Courbe Coppock: | 48.49 |
| MA7: | 0.1291 | |
| MA20: | 0.1156 | |
| MA50: | 0.1237 | |
| MA100: | 0.1535 | |
| MAexp7: | 0.1241 | |
| MAexp20: | 0.1203 | |
| MAexp50: | 0.1284 | |
| MAexp100: | 0.1579 | |
| Price / MA7: | -4.11% | |
| Price / MA20: | +7.09% | |
| Price / MA50: | +0.08% | |
| Price / MA100: | -19.35% | |
| Price / MAexp7: | -0.24% | |
| Price / MAexp20: | +2.91% | |
| Price / MAexp50: | -3.58% | |
| Price / MAexp100: | -21.60% |
News
Don't forget to follow the news on BIOSENIC. At the time of publication of this analysis, the latest news was as follows:
- BioSenic appoints Dr Carole Nicco as Chief Scientific Officer
- BioSenic SA : Information on the total number of voting rights and shares
- BioSenic appoints Michel Wurm, M.D. as Chief Medical Officer
- BioSenic SA provides update on its autoimmune disease platform based on ATO (arsenic trioxide)
- Bone Therapeutics SA: Transparency notification received from S.F.P.I/F.P.I.M
About author
Online


Add a comment
Comments
0 comments on the analysis BIOSENIC - Daily