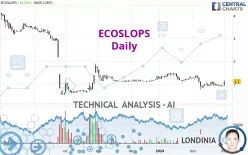
ECOSLOPS - Daily - Technical analysis published on 03/01/2024 (GMT)
- 156
- 0
- Timeframe : Daily
- - Analysis generated on
- Status : NEUTRAL

Summary of the analysis

Additional analysis
Quotes
ECOSLOPS rating 1.100 EUR. On the day, this instrument gained +22.22% with the lowest point at 0.930 EUR and the highest point at 1.155 EUR. The deviation from the price is +18.28% for the low point and -4.76% for the high point.A bullish gap was detected at the opening by the Central Gaps scanner. There are a lot of buyers and they have the upper hand in the very short term.
Opening Gap UP
Type : Bullish
Timeframe : Openning
So that you have an overall view of the price change, here is a table showing the variations over several periods:
Technical
Technical analysis of ECOSLOPS in Daily shows an overall slightly bearish trend. Only 60.71% of the signals given by moving averages are bearish. This slightly bearish trend could return to neutral given the neutral signals also given by short-term moving averages. The Central Indicators scanner detects bullish signals on moving averages that could impact this trend:
Bullish price crossover with Moving Average 20
Type : Bullish
Timeframe : Daily
Bullish price crossover with adaptative moving average 20
Type : Bullish
Timeframe : Daily
The probability of a further increase is slight given the direction of the technical indicators.
Caution: the Central Indicators scanner currently detects an excess:
Williams %R indicator is overbought : over -20
Type : Neutral
Timeframe : Daily
Pivot points : price is over resistance 1
Type : Neutral
Timeframe : Weekly
Pivot points : price is over resistance 3
Type : Neutral
Timeframe : Daily
RSI indicator is back over 50
Type : Bullish
Timeframe : Daily
MACD crosses UP its Moving Average
Type : Bullish
Timeframe : Daily
Parabolic SAR indicator bullish reversal
Type : Bullish
Timeframe : Daily
Momentum indicator is back over 0
Type : Bullish
Timeframe : Daily
The Central Patterns scanner, which studies chart patterns, resistances and supports, has identified this signal:
Near horizontal resistance
Type : Bearish
Timeframe : Daily
The Central Candlesticks scanner, specialised in Japanese candlesticks, did not identify any signals.
| S2 | S1 | Price | R1 | R2 | R3 | |
|---|---|---|---|---|---|---|
| ProTrendLines | 0.540 | 1.096 | 1.100 | 3.267 | 4.558 | 5.800 |
| Change (%) | -50.91% | -0.36% | - | +197.00% | +314.36% | +427.27% |
| Change | -0.560 | -0.004 | - | +2.167 | +3.458 | +4.700 |
| Level | Major | Intermediate | - | Minor | Minor | Minor |
Attention could also be paid to pivot points to set price objectives:
| Pivot points | S3 | S2 | S1 | PP | R1 | R2 | R3 |
|---|---|---|---|---|---|---|---|
| Standard | 0.887 | 0.893 | 0.897 | 0.903 | 0.907 | 0.913 | 0.917 |
| Camarilla | 0.897 | 0.898 | 0.899 | 0.900 | 0.901 | 0.902 | 0.903 |
| Woodie | 0.885 | 0.893 | 0.895 | 0.903 | 0.905 | 0.913 | 0.915 |
| Fibonacci | 0.893 | 0.897 | 0.900 | 0.903 | 0.907 | 0.910 | 0.913 |
| Pivot points | S3 | S2 | S1 | PP | R1 | R2 | R3 |
|---|---|---|---|---|---|---|---|
| Standard | 0.703 | 0.817 | 0.873 | 0.987 | 1.043 | 1.157 | 1.213 |
| Camarilla | 0.883 | 0.899 | 0.914 | 0.930 | 0.946 | 0.961 | 0.977 |
| Woodie | 0.675 | 0.803 | 0.845 | 0.973 | 1.015 | 1.143 | 1.185 |
| Fibonacci | 0.817 | 0.882 | 0.922 | 0.987 | 1.052 | 1.092 | 1.157 |
| Pivot points | S3 | S2 | S1 | PP | R1 | R2 | R3 |
|---|---|---|---|---|---|---|---|
| Standard | 0.007 | 0.373 | 0.637 | 1.003 | 1.267 | 1.633 | 1.897 |
| Camarilla | 0.727 | 0.785 | 0.842 | 0.900 | 0.958 | 1.016 | 1.073 |
| Woodie | -0.045 | 0.348 | 0.585 | 0.978 | 1.215 | 1.608 | 1.845 |
| Fibonacci | 0.373 | 0.614 | 0.763 | 1.003 | 1.244 | 1.393 | 1.633 |
Numerical data
The following is the status of technical indicators and moving averages registered at the time this technical analysis was created:
| RSI (14): | 53.64 | |
| MACD (12,26,9): | -0.0600 | |
| Directional Movement: | 4.480 | |
| AROON (14): | 14.286 | |
| DEMA (21): | 0.926 | |
| Parabolic SAR (0,02-0,02-0,2): | 0.740 | |
| Elder Ray (13): | 0.039 | |
| Super Trend (3,10): | 1.173 | |
| Zig ZAG (10): | 1.050 | |
| VORTEX (21): | 0.8630 | |
| Stochastique (14,3,5): | 46.80 | |
| TEMA (21): | 0.908 | |
| Williams %R (14): | -6.52 | |
| Chande Momentum Oscillator (20): | 0.085 | |
| Repulse (5,40,3): | 10.9830 | |
| ROCnROLL: | -1 | |
| TRIX (15,9): | -0.9670 | |
| Courbe Coppock: | 11.09 |
| MA7: | 0.942 | |
| MA20: | 0.998 | |
| MA50: | 1.168 | |
| MA100: | 1.132 | |
| MAexp7: | 0.965 | |
| MAexp20: | 1.011 | |
| MAexp50: | 1.122 | |
| MAexp100: | 1.474 | |
| Price / MA7: | +16.77% | |
| Price / MA20: | +10.22% | |
| Price / MA50: | -5.82% | |
| Price / MA100: | -2.83% | |
| Price / MAexp7: | +13.99% | |
| Price / MAexp20: | +8.80% | |
| Price / MAexp50: | -1.96% | |
| Price / MAexp100: | -25.37% |
News
Don't forget to follow the news on ECOSLOPS. At the time of publication of this analysis, the latest news was as follows:
- Ecoslops : 2023 Turnover and significant events
- Ecoslops: Planned disposal of Ecoslops Provence, enabling the company to improve its financial situation and refocus on Ecoslops Portugal and the Scarabox
- Ecoslops : Revenues for the first half of 2023
- Ecoslops 2022 Ebitda and Operational Cash-Flow Positive for the First Time, a Key Step Taken by the Group
- ECOSLOPS AND PARLYM JOIN FORCES TO DEVELOP LOCAL RECYCLING OF WASTE OILS ON THE AFRICAN CONTINENT WITH THE SCARABOX
About author
Online


Add a comment
Comments
0 comments on the analysis ECOSLOPS - Daily