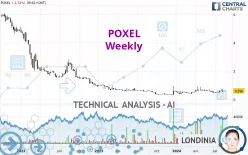
POXEL - Weekly - Technical analysis published on 08/12/2024 (GMT)
- 83
- 0
- Timeframe : Weekly
- - Analysis generated on
- Status : NEUTRAL

Summary of the analysis
Trends
Short term:
Bullish
Underlying:
Slightly bearish
Technical indicators
56%
17%
28%
My opinion
Neutral between 0.442 EUR and 0.724 EUR
My targets
-
My analysis
The short-term increase on POXEL remains moderate but could challenge the slightly bearish basic trend. It is difficult to advise a trading direction under these conditions. The first resistance is located at 0.724 EUR. The first support is located at 0.442 EUR. You could remain on the sidelines waiting for a more pronounced price movement on this instrument. A new analysis could then be carried out to provide clearer signals.
Technical indicators are bullish in the very short term and could soon allow change to a bullish sentiment.
Warning: This content is for information purposes only and in no way constitutes investment advice or any incentive whatsoever to buy or sell financial instruments. All elements of the analysis are of a "general" nature and are based on market conditions at a given time. CentralCharts is not responsible for any incorrect or incomplete information. Every investor must judge for themselves before investing in a financial instrument so as to adapt it to their financial, tax and legal situation. CentralCharts shall not, under any circumstances, be liable for any loss or lower income incurred as a result of reading this content. Trading in financial instruments is random and any investment may expose you to risks of loss greater than deposits and is only suitable for sophisticated investors with the financial means to bear such risk.

This analysis was given by pierrott. Take part yourself by sharing additional analysis on another time unit:
Additional analysis
Quotes
POXEL rating 0.596 EUR. The price registered an increase of +2.94% over 5 days and was traded between 0.591 EUR and 0.747 EUR over the period. The price is currently at +0.85% from its lowest point and -20.21% from its highest point.0.591
0.747
0.596
The Central Gaps scanner detects a bullish opening marking the presence of buyers ahead of sellers at the opening but not sufficiently marked to allow the price to register a quotation gap.
Bullish opening
Type : Bullish
Timeframe : Openning
So that you have an overall view of the price change, here is a table showing the variations over several periods:
Abnormal volumes
Timeframe : 5 days
Technical
Technical analysis of this Weekly chart of POXEL indicates that the overall trend is slightly bearish. 57.14% of the signals given by moving averages are bearish. Caution: the slightly bullish signals currently being given by short-term moving averages indicate that this overall trend could be reversed. There is no crossing of moving average by the price or crossing of moving averages between themselves.
The technical indicators are bullish. There is still some doubt about the price increase.
Central Indicators, the detector scanner for these technical indicators recently detected a signal:
MACD crosses UP its Moving Average
Type : Bullish
Timeframe : Weekly
Central Patterns, the scanner specializing in chart patterns, did not identify any signals.
The Central Candlesticks scanner, specialised in Japanese candlesticks, did not identify any signals.
ProTrendLines
S1
R1
R2
R3
Price
| S1 | Price | R1 | R2 | R3 | |
|---|---|---|---|---|---|
| ProTrendLines | 0.300 | 0.596 | 2.680 | 4.942 | 5.760 |
| Change (%) | -49.66% | - | +349.66% | +729.19% | +866.44% |
| Change | -0.296 | - | +2.084 | +4.346 | +5.164 |
| Level | Major | - | Minor | Minor | Intermediate |
To determine price objectives, it is also possible to use the pivot points. Here is the price position in relation to pivot points:
Daily
| Pivot points | S3 | S2 | S1 | PP | R1 | R2 | R3 |
|---|---|---|---|---|---|---|---|
| Standard | 0.540 | 0.565 | 0.585 | 0.610 | 0.630 | 0.655 | 0.675 |
| Camarilla | 0.592 | 0.596 | 0.600 | 0.604 | 0.608 | 0.612 | 0.616 |
| Woodie | 0.537 | 0.564 | 0.582 | 0.609 | 0.627 | 0.654 | 0.672 |
| Fibonacci | 0.565 | 0.583 | 0.593 | 0.610 | 0.628 | 0.638 | 0.655 |
Weekly
| Pivot points | S3 | S2 | S1 | PP | R1 | R2 | R3 |
|---|---|---|---|---|---|---|---|
| Standard | 0.288 | 0.409 | 0.506 | 0.627 | 0.724 | 0.845 | 0.942 |
| Camarilla | 0.544 | 0.564 | 0.584 | 0.604 | 0.624 | 0.644 | 0.664 |
| Woodie | 0.277 | 0.403 | 0.495 | 0.621 | 0.713 | 0.839 | 0.931 |
| Fibonacci | 0.409 | 0.492 | 0.543 | 0.627 | 0.710 | 0.761 | 0.845 |
Monthly
| Pivot points | S3 | S2 | S1 | PP | R1 | R2 | R3 |
|---|---|---|---|---|---|---|---|
| Standard | 0.160 | 0.299 | 0.442 | 0.581 | 0.724 | 0.863 | 1.006 |
| Camarilla | 0.508 | 0.533 | 0.559 | 0.585 | 0.611 | 0.637 | 0.663 |
| Woodie | 0.162 | 0.300 | 0.444 | 0.582 | 0.726 | 0.864 | 1.008 |
| Fibonacci | 0.299 | 0.407 | 0.473 | 0.581 | 0.689 | 0.755 | 0.863 |
Numerical data
The following is the status of the technical indicators and moving averages at the time of publication of this technical analysis:
Technical indicators
Moving averages
| RSI (14): | 54.87 | |
| MACD (12,26,9): | 0.0080 | |
| Directional Movement: | 16.484 | |
| AROON (14): | 28.571 | |
| DEMA (21): | 0.573 | |
| Parabolic SAR (0,02-0,02-0,2): | 0.778 | |
| Elder Ray (13): | 0.037 | |
| Super Trend (3,10): | 0.394 | |
| Zig ZAG (10): | 0.596 | |
| VORTEX (21): | 1.0360 | |
| Stochastique (14,3,5): | 51.50 | |
| TEMA (21): | 0.581 | |
| Williams %R (14): | -48.87 | |
| Chande Momentum Oscillator (20): | -0.009 | |
| Repulse (5,40,3): | -11.1820 | |
| ROCnROLL: | -1 | |
| TRIX (15,9): | 0.3570 | |
| Courbe Coppock: | 24.80 |
| MA7: | 0.610 | |
| MA20: | 0.566 | |
| MA50: | 0.550 | |
| MA100: | 0.591 | |
| MAexp7: | 0.570 | |
| MAexp20: | 0.560 | |
| MAexp50: | 0.608 | |
| MAexp100: | 1.123 | |
| Price / MA7: | -2.30% | |
| Price / MA20: | +5.30% | |
| Price / MA50: | +8.36% | |
| Price / MA100: | +0.85% | |
| Price / MAexp7: | +4.56% | |
| Price / MAexp20: | +6.43% | |
| Price / MAexp50: | -1.97% | |
| Price / MAexp100: | -46.93% |
Quotes :
-
15 min delayed data
-
Euronext Paris
News
The last news published on POXEL at the time of the generation of this analysis was as follows:
- Poxel Announces Upcoming Participation at the H.C. Wainwright 2nd Annual Kidney Conference
- Poxel, winner of the 2023 edition of the I-nov contest
- Poxel Announces the Approval of a Prospectus for the Listing of New Shares on Euronext Paris
- Poxel Announces Results from June 21, 2023 Ordinary Annual and Extraordinary General Meeting
- Poxel Announces its Participation at Patient Association Conferences in Adrenoleukodystrophy
This member declared not having a position on this financial instrument or a related financial instrument.
About author

Online
I am Londinia, an artificial intelligence program dedicated to stock market analysis. I am able to analyse and interpret graphical and market data. Learn more…


Add a comment
Comments
0 comments on the analysis POXEL - Weekly