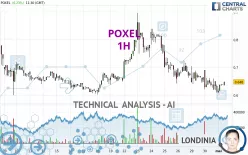
POXEL - 1H - Technical analysis published on 05/02/2024 (GMT)
- 145
- 0
- Timeframe : 1H
- - Analysis generated on
- Status : NEUTRAL

Summary of the analysis

Additional analysis
Quotes
POXEL rating 0.648 EUR. The price has increased by +6.23% since the last closing and was traded between 0.609 EUR and 0.649 EUR over the period. The price is currently at +6.40% from its lowest and -0.15% from its highest.Here is a more detailed summary of the historical variations registered by POXEL:
Abnormal volumes
Timeframe : 5 days
Abnormal volumes
Timeframe : 20 days
Abnormal volumes
Timeframe : 50 days
Technical
A technical analysis in 1H of this POXEL chart shows a slightly bearish trend. 60.71% of the signals given by moving averages are bearish. As the signals currently given by short-term moving averages are rather neutral, the slightly bearish trend could return to neutral. The Central Indicators scanner detects a bullish signal on moving averages that could impact this trend:
Bullish price crossover with Moving Average 20
Type : Bullish
Timeframe : 1 hour
In fact, according to the parameters integrated into the Central Analyzer system, only 9 technical indicators out of 18 analysed are currently bullish. Central Indicators, the scanner specialised in technical indicators, has identified these signals:
Parabolic SAR indicator bullish reversal
Type : Bullish
Timeframe : 1 hour
Price is back over the pivot point
Type : Bullish
Timeframe : 1 hour
An analysis of the price chart with the Central Patterns scanner (detector of chart patterns and resistances and supports) shows a result that can have an impact on the price change:
Near resistance of channel
Type : Bearish
Timeframe : 1 hour
No result was found by the Central Candlesticks scanner on Japanese candlesticks.
| S3 | S2 | S1 | Price | R1 | R2 | R3 | |
|---|---|---|---|---|---|---|---|
| ProTrendLines | 0.517 | 0.566 | 0.615 | 0.648 | 0.652 | 0.689 | 0.732 |
| Change (%) | -20.22% | -12.65% | -5.09% | - | +0.62% | +6.33% | +12.96% |
| Change | -0.131 | -0.082 | -0.033 | - | +0.004 | +0.041 | +0.084 |
| Level | Intermediate | Minor | Major | - | Major | Intermediate | Intermediate |
Attention could also be paid to pivot points to set price objectives:
| Pivot points | S3 | S2 | S1 | PP | R1 | R2 | R3 |
|---|---|---|---|---|---|---|---|
| Standard | 0.503 | 0.557 | 0.583 | 0.637 | 0.663 | 0.717 | 0.743 |
| Camarilla | 0.588 | 0.595 | 0.603 | 0.610 | 0.617 | 0.625 | 0.632 |
| Woodie | 0.490 | 0.550 | 0.570 | 0.630 | 0.650 | 0.710 | 0.730 |
| Fibonacci | 0.557 | 0.587 | 0.606 | 0.637 | 0.667 | 0.686 | 0.717 |
| Pivot points | S3 | S2 | S1 | PP | R1 | R2 | R3 |
|---|---|---|---|---|---|---|---|
| Standard | 0.324 | 0.483 | 0.578 | 0.737 | 0.832 | 0.991 | 1.086 |
| Camarilla | 0.603 | 0.626 | 0.650 | 0.673 | 0.696 | 0.720 | 0.743 |
| Woodie | 0.292 | 0.467 | 0.546 | 0.721 | 0.800 | 0.975 | 1.054 |
| Fibonacci | 0.483 | 0.580 | 0.640 | 0.737 | 0.834 | 0.894 | 0.991 |
| Pivot points | S3 | S2 | S1 | PP | R1 | R2 | R3 |
|---|---|---|---|---|---|---|---|
| Standard | 0.094 | 0.313 | 0.461 | 0.680 | 0.828 | 1.047 | 1.195 |
| Camarilla | 0.509 | 0.543 | 0.576 | 0.610 | 0.644 | 0.677 | 0.711 |
| Woodie | 0.060 | 0.295 | 0.427 | 0.662 | 0.794 | 1.029 | 1.161 |
| Fibonacci | 0.313 | 0.453 | 0.540 | 0.680 | 0.820 | 0.907 | 1.047 |
Numerical data
The following are the details of the technical indicators and moving averages that were collected to generate this technical analysis:
| RSI (14): | 48.88 | |
| MACD (12,26,9): | -0.0140 | |
| Directional Movement: | 1.301 | |
| AROON (14): | -64.286 | |
| DEMA (21): | 0.625 | |
| Parabolic SAR (0,02-0,02-0,2): | 0.609 | |
| Elder Ray (13): | 0.004 | |
| Super Trend (3,10): | 0.695 | |
| Zig ZAG (10): | 0.649 | |
| VORTEX (21): | 0.9590 | |
| Stochastique (14,3,5): | 40.33 | |
| TEMA (21): | 0.627 | |
| Williams %R (14): | -50.62 | |
| Chande Momentum Oscillator (20): | 0.011 | |
| Repulse (5,40,3): | 2.6870 | |
| ROCnROLL: | -1 | |
| TRIX (15,9): | -0.3840 | |
| Courbe Coppock: | 7.19 |
| MA7: | 0.683 | |
| MA20: | 0.672 | |
| MA50: | 0.557 | |
| MA100: | 0.514 | |
| MAexp7: | 0.637 | |
| MAexp20: | 0.645 | |
| MAexp50: | 0.671 | |
| MAexp100: | 0.677 | |
| Price / MA7: | -5.12% | |
| Price / MA20: | -3.57% | |
| Price / MA50: | +16.34% | |
| Price / MA100: | +26.07% | |
| Price / MAexp7: | +1.73% | |
| Price / MAexp20: | +0.47% | |
| Price / MAexp50: | -3.43% | |
| Price / MAexp100: | -4.28% |
News
The last news published on POXEL at the time of the generation of this analysis was as follows:
- Poxel Announces Upcoming Participation at the H.C. Wainwright 2nd Annual Kidney Conference
- Poxel, winner of the 2023 edition of the I-nov contest
- Poxel Announces the Approval of a Prospectus for the Listing of New Shares on Euronext Paris
- Poxel Announces Results from June 21, 2023 Ordinary Annual and Extraordinary General Meeting
- Poxel Announces its Participation at Patient Association Conferences in Adrenoleukodystrophy
About author
Online


Add a comment
Comments
0 comments on the analysis POXEL - 1H