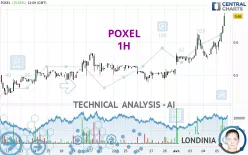
POXEL - 1H - Technical analysis published on 04/05/2024 (GMT)
- 180
- 0
Click here for a new analysis!
- Timeframe : 1H
- - Analysis generated on
- Status : TARGET REACHED

Summary of the analysis

Additional analysis
Quotes
The POXEL price is 0.680 EUR. The price registered an increase of +15.65% on the session with the lowest point at 0.564 EUR and the highest point at 0.680 EUR. The deviation from the price is +20.57% for the low point and 0% for the high point.The Central Gaps scanner detects a bullish opening. A small advantage for buyers in the very short term.
Bullish opening
Type : Bullish
Timeframe : Openning
Here is a more detailed summary of the historical variations registered by POXEL:
New HIGH record (1st january)
Type : Bullish
Timeframe : Weekly
New HIGH record (1 month)
Type : Bullish
Timeframe : Weekly
Abnormal volumes on POXEL were detected by the Central Volumes scanner:
Abnormal volumes
Timeframe : 5 days
Technical
A technical analysis in 1H of this POXEL chart shows a strongly bullish trend. The signals given by the moving averages are 92.86% bullish. This strong bullish trend is confirmed by the strong signals currently being given by short-term moving averages. The Central Indicators scanner does not detect any result on moving averages that would impact this trend.
An assessment of technical indicators shows a strong bullish signal.
Caution: the Central Indicators scanner currently detects an excess:
RSI indicator is overbought : over 70
Type : Neutral
Timeframe : 1 hour
CCI indicator is overbought : over 100
Type : Neutral
Timeframe : 1 hour
Williams %R indicator is overbought : over -20
Type : Neutral
Timeframe : 1 hour
Pivot points : price is over resistance 3
Type : Neutral
Timeframe : 1 hour
Pivot points : price is over resistance 3
Type : Neutral
Timeframe : Weekly
No signals are given by Central Patterns, a market scanner specialised in chart patterns, resistances and supports.
The Central Candlesticks scanner which studies Japanese candlesticks did not detect anything.
| S3 | S2 | S1 | Price | R1 | R2 | R3 | |
|---|---|---|---|---|---|---|---|
| ProTrendLines | 0.612 | 0.650 | 0.678 | 0.680 | 2.680 | 4.925 | 5.775 |
| Change (%) | -10.00% | -4.38% | -0.32% | - | +294.12% | +624.26% | +749.26% |
| Change | -0.068 | -0.030 | -0.002 | - | +2.000 | +4.245 | +5.095 |
| Level | Intermediate | Intermediate | Minor | - | Minor | Intermediate | Intermediate |
Attention could also be paid to pivot points to set price objectives:
| Pivot points | S3 | S2 | S1 | PP | R1 | R2 | R3 |
|---|---|---|---|---|---|---|---|
| Standard | 0.506 | 0.528 | 0.558 | 0.580 | 0.610 | 0.632 | 0.662 |
| Camarilla | 0.574 | 0.579 | 0.583 | 0.588 | 0.593 | 0.598 | 0.602 |
| Woodie | 0.510 | 0.530 | 0.562 | 0.582 | 0.614 | 0.634 | 0.666 |
| Fibonacci | 0.528 | 0.548 | 0.560 | 0.580 | 0.600 | 0.612 | 0.632 |
| Pivot points | S3 | S2 | S1 | PP | R1 | R2 | R3 |
|---|---|---|---|---|---|---|---|
| Standard | 0.434 | 0.455 | 0.487 | 0.508 | 0.540 | 0.561 | 0.593 |
| Camarilla | 0.503 | 0.508 | 0.513 | 0.518 | 0.523 | 0.528 | 0.533 |
| Woodie | 0.439 | 0.458 | 0.492 | 0.511 | 0.545 | 0.564 | 0.598 |
| Fibonacci | 0.455 | 0.476 | 0.488 | 0.508 | 0.529 | 0.541 | 0.561 |
| Pivot points | S3 | S2 | S1 | PP | R1 | R2 | R3 |
|---|---|---|---|---|---|---|---|
| Standard | 0.277 | 0.345 | 0.432 | 0.500 | 0.587 | 0.655 | 0.742 |
| Camarilla | 0.475 | 0.490 | 0.504 | 0.518 | 0.532 | 0.546 | 0.561 |
| Woodie | 0.286 | 0.350 | 0.441 | 0.505 | 0.596 | 0.660 | 0.751 |
| Fibonacci | 0.345 | 0.405 | 0.441 | 0.500 | 0.560 | 0.596 | 0.655 |
Numerical data
The following is the status of technical indicators and moving averages registered at the time this technical analysis was created:
| RSI (14): | 72.44 | |
| MACD (12,26,9): | 0.0190 | |
| Directional Movement: | 24.334 | |
| AROON (14): | 71.429 | |
| DEMA (21): | 0.611 | |
| Parabolic SAR (0,02-0,02-0,2): | 0.554 | |
| Elder Ray (13): | 0.035 | |
| Super Trend (3,10): | 0.576 | |
| Zig ZAG (10): | 0.639 | |
| VORTEX (21): | 1.1590 | |
| Stochastique (14,3,5): | 96.40 | |
| TEMA (21): | 0.619 | |
| Williams %R (14): | 0.00 | |
| Chande Momentum Oscillator (20): | 0.080 | |
| Repulse (5,40,3): | 8.9290 | |
| ROCnROLL: | 1 | |
| TRIX (15,9): | 0.3840 | |
| Courbe Coppock: | 11.21 |
| MA7: | 0.553 | |
| MA20: | 0.510 | |
| MA50: | 0.489 | |
| MA100: | 0.456 | |
| MAexp7: | 0.613 | |
| MAexp20: | 0.587 | |
| MAexp50: | 0.561 | |
| MAexp100: | 0.538 | |
| Price / MA7: | +22.97% | |
| Price / MA20: | +33.33% | |
| Price / MA50: | +39.06% | |
| Price / MA100: | +49.12% | |
| Price / MAexp7: | +10.93% | |
| Price / MAexp20: | +15.84% | |
| Price / MAexp50: | +21.21% | |
| Price / MAexp100: | +26.39% |
News
The latest news and videos published on POXEL at the time of the analysis were as follows:
- Poxel Announces Upcoming Participation at the H.C. Wainwright 2nd Annual Kidney Conference
- Poxel, winner of the 2023 edition of the I-nov contest
- Poxel Announces the Approval of a Prospectus for the Listing of New Shares on Euronext Paris
- Poxel Announces Results from June 21, 2023 Ordinary Annual and Extraordinary General Meeting
- Poxel Announces its Participation at Patient Association Conferences in Adrenoleukodystrophy
About author
Online


Add a comment
Comments
0 comments on the analysis POXEL - 1H