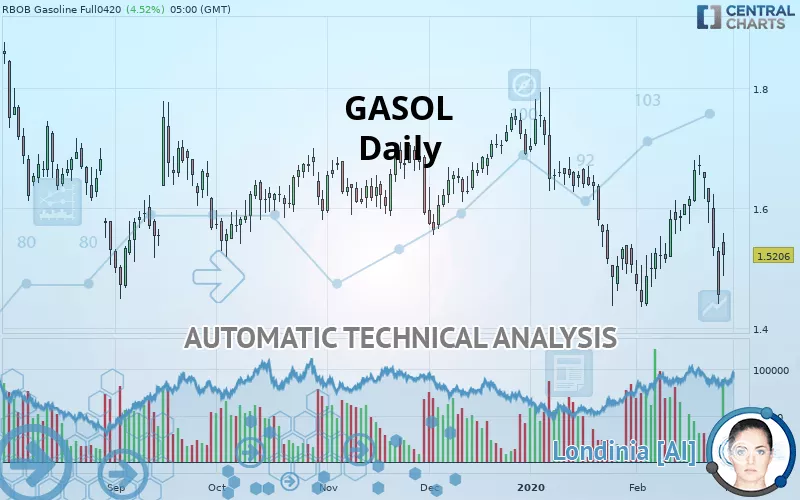
GASOL - Daily - Technical analysis published on 02/28/2020 (GMT)
- 380
- 0
- Who voted?
Click here for a new analysis!
- Timeframe : Daily
- - Analysis generated on
- Status : TARGET REACHED

Summary of the analysis

Additional analysis
Quotes
GASOL rating 1.5206 USD. The price registered a decrease of +4.52% on the session and was traded between 1.4863 USD and 1.5583 USD over the period. The price is currently at +2.31% from its lowest and -2.42% from its highest.The Central Gaps scanner detects a bearish opening marking the presence of sellers ahead of buyers at the opening but not sufficiently marked to allow the price to register a quotation gap.
Bearish opening
Type : Bearish
Timeframe : Openning
So that you have an overall view of the price change, here is a table showing the variations over several periods:
Near a new LOW record (1st january)
Type : Bearish
Timeframe : Weekly
Near a new LOW record (1 month)
Type : Bearish
Timeframe : Weekly
Technical
Technical analysis of this Daily chart of GASOL indicates that the overall trend is strongly bearish. 92.86% of the signals given by moving averages are bearish. The overall trend is supported by the strong bearish signals from short-term moving averages. An assessment of moving averages reveals several bearish signals that could impact this trend:
Bearish trend reversal : Moving Average 50
Type : Bearish
Timeframe : Daily
Bearish trend reversal : Moving Average 100
Type : Bearish
Timeframe : Daily
Bearish trend reversal : adaptative moving average 20
Type : Bearish
Timeframe : Daily
Bearish trend reversal : adaptative moving average 50
Type : Bearish
Timeframe : Daily
Bearish trend reversal : adaptative moving average 100
Type : Bearish
Timeframe : Daily
In fact, of the 18 technical indicators analysed by Central Analyzer, 5 are bullish, 4 are neutral and 9 are bearish. But beware of excesses. The Central Indicators scanner currently detects this:
Williams %R indicator is oversold : under -80
Type : Neutral
Timeframe : Daily
Pivot points : price is over resistance 1
Type : Neutral
Timeframe : Weekly
Pivot points : price is under support 3
Type : Neutral
Timeframe : Daily
MACD crosses DOWN its Moving Average
Type : Bearish
Timeframe : Daily
SuperTrend indicator bearish reversal
Type : Bearish
Timeframe : Daily
MACD indicator is back under 0
Type : Bearish
Timeframe : Daily
Momentum indicator is back under 0
Type : Bearish
Timeframe : Daily
No signals are given by Central Patterns, a market scanner specialised in chart patterns, resistances and supports.
The Central Candlesticks scanner which studies Japanese candlesticks did not detect anything.
| S3 | S2 | S1 | Price | R1 | R2 | R3 | |
|---|---|---|---|---|---|---|---|
| ProTrendLines | 0.8989 | 1.2560 | 1.4705 | 1.5206 | 1.5604 | 1.6493 | 1.7555 |
| Change (%) | -40.89% | -17.40% | -3.29% | - | +2.62% | +8.46% | +15.45% |
| Change | -0.6217 | -0.2646 | -0.0501 | - | +0.0398 | +0.1287 | +0.2349 |
| Level | Minor | Major | Major | - | Major | Minor | Major |
Pivot points can also be used to set your price objectives. Here is the price situation in relation to pivot points:
| Pivot points | S3 | S2 | S1 | PP | R1 | R2 | R3 |
|---|---|---|---|---|---|---|---|
| Standard | 1.3894 | 1.4547 | 1.4935 | 1.5588 | 1.5976 | 1.6629 | 1.7017 |
| Camarilla | 1.5038 | 1.5133 | 1.5229 | 1.5324 | 1.5419 | 1.5515 | 1.5610 |
| Woodie | 1.3763 | 1.4481 | 1.4804 | 1.5522 | 1.5845 | 1.6563 | 1.6886 |
| Fibonacci | 1.4547 | 1.4944 | 1.5190 | 1.5588 | 1.5985 | 1.6231 | 1.6629 |
| Pivot points | S3 | S2 | S1 | PP | R1 | R2 | R3 |
|---|---|---|---|---|---|---|---|
| Standard | 1.3999 | 1.4487 | 1.5160 | 1.5648 | 1.6321 | 1.6809 | 1.7482 |
| Camarilla | 1.5514 | 1.5620 | 1.5727 | 1.5833 | 1.5939 | 1.6046 | 1.6152 |
| Woodie | 1.4092 | 1.4533 | 1.5253 | 1.5694 | 1.6414 | 1.6855 | 1.7575 |
| Fibonacci | 1.4487 | 1.4931 | 1.5205 | 1.5648 | 1.6092 | 1.6366 | 1.6809 |
| Pivot points | S3 | S2 | S1 | PP | R1 | R2 | R3 |
|---|---|---|---|---|---|---|---|
| Standard | 0.9963 | 1.2166 | 1.3604 | 1.5807 | 1.7245 | 1.9448 | 2.0886 |
| Camarilla | 1.4040 | 1.4374 | 1.4707 | 1.5041 | 1.5375 | 1.5709 | 1.6042 |
| Woodie | 0.9580 | 1.1975 | 1.3221 | 1.5616 | 1.6862 | 1.9257 | 2.0503 |
| Fibonacci | 1.2166 | 1.3557 | 1.4417 | 1.5807 | 1.7198 | 1.8058 | 1.9448 |
Numerical data
The following is the status of the technical indicators and moving averages at the time of publication of this technical analysis:
| RSI (14): | 34.32 | |
| MACD (12,26,9): | -0.0054 | |
| Directional Movement: | -18.0406 | |
| AROON (14): | -28.5714 | |
| DEMA (21): | 1.5628 | |
| Parabolic SAR (0,02-0,02-0,2): | 1.6790 | |
| Elder Ray (13): | -0.0837 | |
| Super Trend (3,10): | 1.6732 | |
| Zig ZAG (10): | 1.4549 | |
| VORTEX (21): | 0.9514 | |
| Stochastique (14,3,5): | 34.79 | |
| TEMA (21): | 1.5743 | |
| Williams %R (14): | -93.84 | |
| Chande Momentum Oscillator (20): | -0.0664 | |
| Repulse (5,40,3): | -9.8688 | |
| ROCnROLL: | 2 | |
| TRIX (15,9): | -0.0462 | |
| Courbe Coppock: | 12.00 |
| MA7: | 1.5993 | |
| MA20: | 1.5508 | |
| MA50: | 1.6145 | |
| MA100: | 1.6252 | |
| MAexp7: | 1.5629 | |
| MAexp20: | 1.5723 | |
| MAexp50: | 1.5938 | |
| MAexp100: | 1.6241 | |
| Price / MA7: | -4.92% | |
| Price / MA20: | -1.95% | |
| Price / MA50: | -5.82% | |
| Price / MA100: | -6.44% | |
| Price / MAexp7: | -2.71% | |
| Price / MAexp20: | -3.29% | |
| Price / MAexp50: | -4.59% | |
| Price / MAexp100: | -6.37% |
About author

Online


Add a comment
Comments
0 comments on the analysis GASOL - Daily