GASOL - Daily - Technical analysis published on 12/10/2019 (GMT)
- 306
- 0
- Who voted?
Click here for a new analysis!
- Timeframe : Daily
- - Analysis generated on
- Status : INVALID
Summary of the analysis

Additional analysis
Quotes
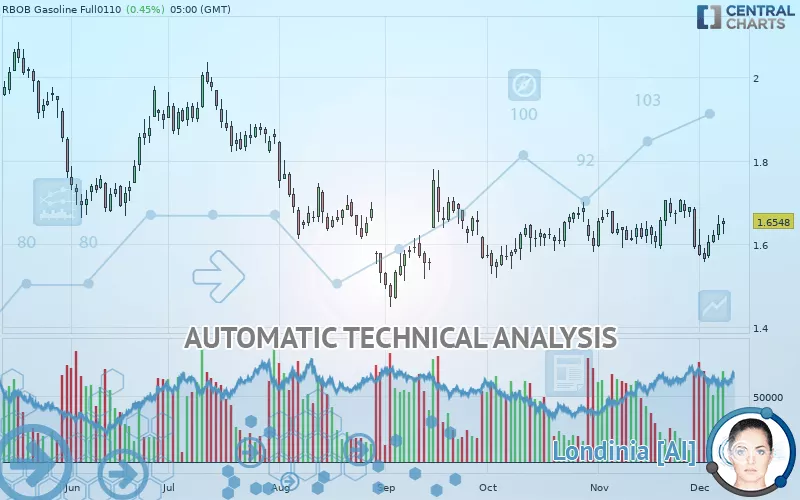
The GASOL price is 1.6548 USD. The price has increased by +0.45% since the last closing with the lowest point at 1.6228 USD and the highest point at 1.6622 USD. The deviation from the price is +1.97% for the low point and -0.45% for the high point.The Central Gaps scanner detects a bullish opening marking the presence of buyers ahead of sellers at the opening but not sufficiently marked to allow the price to register a quotation gap.
Bullish opening
Type : Bullish
Timeframe : Openning
Here is a more detailed summary of the historical variations registered by GASOL:
Technical
Technical analysis of this Daily chart of GASOL indicates that the overall trend is not clearly defined. The strong bullish signals currently being given by short-term moving averages could allow the overall trend to return to bullish. An assessment of moving averages reveals several bullish signals that could impact this trend:
Bullish price crossover with Moving Average 20
Type : Bullish
Timeframe : Daily
Bullish price crossover with Moving Average 50
Type : Bullish
Timeframe : Daily
Bullish price crossover with adaptative moving average 20
Type : Bullish
Timeframe : Daily
On the 18 technical indicators analysed, 8 are bullish, 5 are neutral and 5 are bearish. Other results related to technical indicators were also found by the Central Indicators scanner:
Pivot points : price is over resistance 1
Type : Neutral
Timeframe : Daily
RSI indicator is back over 50
Type : Bullish
Timeframe : Daily
Ichimoku : price is over the cloud
Type : Bullish
Timeframe : Daily
Price is back under the pivot point
Type : Bearish
Timeframe : Weekly
Momentum indicator is back under 0
Type : Bearish
Timeframe : Daily
Williams %R indicator is back over -50
Type : Bullish
Timeframe : Daily
Central Patterns, the scanner specializing in chart patterns, did not identify any signals.
The Central Candlesticks scanner which studies Japanese candlesticks did not detect anything.
| S3 | S2 | S1 | Price | R1 | R2 | R3 | |
|---|---|---|---|---|---|---|---|
| ProTrendLines | 1.4717 | 1.5553 | 1.6467 | 1.6548 | 1.7552 | 1.8436 | 2.0076 |
| Change (%) | -11.06% | -6.01% | -0.49% | - | +6.07% | +11.41% | +21.32% |
| Change | -0.1831 | -0.0995 | -0.0081 | - | +0.1004 | +0.1888 | +0.3528 |
| Level | Major | Major | Major | - | Minor | Intermediate | Intermediate |
Pivot points can also be used to set your price objectives. Here is the price situation in relation to pivot points:
| Pivot points | S3 | S2 | S1 | PP | R1 | R2 | R3 |
|---|---|---|---|---|---|---|---|
| Standard | 1.5746 | 1.5882 | 1.6047 | 1.6183 | 1.6348 | 1.6484 | 1.6649 |
| Camarilla | 1.6128 | 1.6156 | 1.6183 | 1.6211 | 1.6239 | 1.6266 | 1.6294 |
| Woodie | 1.5760 | 1.5889 | 1.6061 | 1.6190 | 1.6362 | 1.6491 | 1.6663 |
| Fibonacci | 1.5882 | 1.5997 | 1.6068 | 1.6183 | 1.6298 | 1.6369 | 1.6484 |
| Pivot points | S3 | S2 | S1 | PP | R1 | R2 | R3 |
|---|---|---|---|---|---|---|---|
| Standard | 1.4295 | 1.5086 | 1.5498 | 1.6289 | 1.6701 | 1.7492 | 1.7904 |
| Camarilla | 1.5579 | 1.5690 | 1.5800 | 1.5910 | 1.6020 | 1.6131 | 1.6241 |
| Woodie | 1.4106 | 1.4991 | 1.5309 | 1.6194 | 1.6512 | 1.7397 | 1.7715 |
| Fibonacci | 1.5086 | 1.5546 | 1.5830 | 1.6289 | 1.6749 | 1.7033 | 1.7492 |
| Pivot points | S3 | S2 | S1 | PP | R1 | R2 | R3 |
|---|---|---|---|---|---|---|---|
| Standard | 1.4263 | 1.5065 | 1.5488 | 1.6290 | 1.6713 | 1.7515 | 1.7938 |
| Camarilla | 1.5573 | 1.5685 | 1.5798 | 1.5910 | 1.6022 | 1.6135 | 1.6247 |
| Woodie | 1.4073 | 1.4970 | 1.5298 | 1.6195 | 1.6523 | 1.7420 | 1.7748 |
| Fibonacci | 1.5065 | 1.5533 | 1.5822 | 1.6290 | 1.6758 | 1.7047 | 1.7515 |
Numerical data
The following are the details of the technical indicators and moving averages that were collected to generate this technical analysis:
| RSI (14): | 52.01 | |
| MACD (12,26,9): | -0.0050 | |
| Directional Movement: | 2.3330 | |
| AROON (14): | -50.0000 | |
| DEMA (21): | 1.6286 | |
| Parabolic SAR (0,02-0,02-0,2): | 1.6766 | |
| Elder Ray (13): | 0.0092 | |
| Super Trend (3,10): | 1.5562 | |
| Zig ZAG (10): | 1.6474 | |
| VORTEX (21): | 0.9856 | |
| Stochastique (14,3,5): | 44.87 | |
| TEMA (21): | 1.6215 | |
| Williams %R (14): | -40.12 | |
| Chande Momentum Oscillator (20): | -0.0089 | |
| Repulse (5,40,3): | 1.5561 | |
| ROCnROLL: | 1 | |
| TRIX (15,9): | 0.0022 | |
| Courbe Coppock: | 1.60 |
| MA7: | 1.6124 | |
| MA20: | 1.6358 | |
| MA50: | 1.6259 | |
| MA100: | 1.6502 | |
| MAexp7: | 1.6235 | |
| MAexp20: | 1.6327 | |
| MAexp50: | 1.6387 | |
| MAexp100: | 1.6651 | |
| Price / MA7: | +2.63% | |
| Price / MA20: | +1.16% | |
| Price / MA50: | +1.78% | |
| Price / MA100: | +0.28% | |
| Price / MAexp7: | +1.93% | |
| Price / MAexp20: | +1.35% | |
| Price / MAexp50: | +0.98% | |
| Price / MAexp100: | -0.62% |
About author

Online


Add a comment
Comments
0 comments on the analysis GASOL - Daily