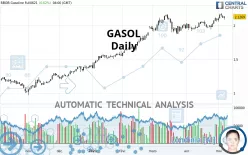
GASOL - Daily - Technical analysis published on 05/09/2021 (GMT)
- 279
- 0
Click here for a new analysis!
- Timeframe : Daily
- - Analysis generated on
- Status : TARGET REACHED

Summary of the analysis

Additional analysis
Quotes
GASOL rating 2.1269 USD. The price registered an increase of +0.62% on the session and was between 2.0856 USD and 2.1400 USD. This implies that the price is at +1.98% from its lowest and at -0.61% from its highest.The Central Gaps scanner detects a bullish opening marking the presence of buyers ahead of sellers at the opening but not sufficiently marked to allow the price to register a quotation gap.
Bullish opening
Type : Bullish
Timeframe : Openning
Here is a more detailed summary of the historical variations registered by GASOL:
Near a new HIGH record (5 years)
Type : Bullish
Timeframe : Weekly
Near a new HIGH record (1st january)
Type : Bullish
Timeframe : Weekly
Near a new HIGH record (1 month)
Type : Bullish
Timeframe : Weekly
Technical
A technical analysis in Daily of this GASOL chart shows a strongly bullish trend. 92.86% of the signals given by moving averages are bullish. The overall trend is supported by the strong bullish signals from short-term moving averages. The Central Indicators market scanner currently does not detect any result that concerns moving averages.
In fact, 13 technical indicators on 18 studied are currently positioned bullish. Caution: the Central Indicators scanner currently detects an excess:
CCI indicator is overbought : over 100
Type : Neutral
Timeframe : Daily
Price is back over the pivot point
Type : Bullish
Timeframe : Weekly
Price is back under the pivot point
Type : Bearish
Timeframe : Daily
No signals are given by Central Patterns, a market scanner specialised in chart patterns, resistances and supports.
The presence of a bearish pattern in Japanese candlesticks detected by Central Candlesticks that could cause a correction in the very short term was also detected:
Black evening star
Type : Bearish
Timeframe : Daily
| S3 | S2 | S1 | Price | R1 | R2 | R3 | |
|---|---|---|---|---|---|---|---|
| ProTrendLines | 1.5561 | 1.8436 | 1.9749 | 2.1269 | 2.1500 | 2.2702 | 3.1333 |
| Change (%) | -26.84% | -13.32% | -7.15% | - | +1.09% | +6.74% | +47.32% |
| Change | -0.5708 | -0.2833 | -0.1520 | - | +0.0231 | +0.1433 | +1.0064 |
| Level | Major | Minor | Major | - | Major | Intermediate | Minor |
To determine price objectives, it is also possible to use the pivot points. Here is the price position in relation to pivot points:
| Pivot points | S3 | S2 | S1 | PP | R1 | R2 | R3 |
|---|---|---|---|---|---|---|---|
| Standard | 2.0517 | 2.0804 | 2.0970 | 2.1257 | 2.1423 | 2.1710 | 2.1876 |
| Camarilla | 2.1012 | 2.1054 | 2.1096 | 2.1137 | 2.1179 | 2.1220 | 2.1262 |
| Woodie | 2.0458 | 2.0774 | 2.0911 | 2.1227 | 2.1364 | 2.1680 | 2.1817 |
| Fibonacci | 2.0804 | 2.0977 | 2.1084 | 2.1257 | 2.1430 | 2.1537 | 2.1710 |
| Pivot points | S3 | S2 | S1 | PP | R1 | R2 | R3 |
|---|---|---|---|---|---|---|---|
| Standard | 1.7941 | 1.8678 | 1.9721 | 2.0458 | 2.1501 | 2.2238 | 2.3281 |
| Camarilla | 2.0274 | 2.0437 | 2.0600 | 2.0763 | 2.0926 | 2.1089 | 2.1253 |
| Woodie | 1.8093 | 1.8755 | 1.9873 | 2.0535 | 2.1653 | 2.2315 | 2.3433 |
| Fibonacci | 1.8678 | 1.9358 | 1.9778 | 2.0458 | 2.1138 | 2.1558 | 2.2238 |
| Pivot points | S3 | S2 | S1 | PP | R1 | R2 | R3 |
|---|---|---|---|---|---|---|---|
| Standard | 1.7541 | 1.8358 | 1.9561 | 2.0378 | 2.1581 | 2.2398 | 2.3601 |
| Camarilla | 2.0208 | 2.0393 | 2.0578 | 2.0763 | 2.0948 | 2.1133 | 2.1319 |
| Woodie | 1.7733 | 1.8455 | 1.9753 | 2.0475 | 2.1773 | 2.2495 | 2.3793 |
| Fibonacci | 1.8358 | 1.9130 | 1.9607 | 2.0378 | 2.1150 | 2.1627 | 2.2398 |
Numerical data
The following is the status of the technical indicators and moving averages at the time of publication of this technical analysis:
| RSI (14): | 62.38 | |
| MACD (12,26,9): | 0.0419 | |
| Directional Movement: | 8.3200 | |
| AROON (14): | 50.0000 | |
| DEMA (21): | 2.1133 | |
| Parabolic SAR (0,02-0,02-0,2): | 2.0079 | |
| Elder Ray (13): | 0.0285 | |
| Super Trend (3,10): | 1.9921 | |
| Zig ZAG (10): | 2.1317 | |
| VORTEX (21): | 1.1439 | |
| Stochastique (14,3,5): | 79.23 | |
| TEMA (21): | 2.1237 | |
| Williams %R (14): | -20.99 | |
| Chande Momentum Oscillator (20): | 0.1483 | |
| Repulse (5,40,3): | 1.4156 | |
| ROCnROLL: | 1 | |
| TRIX (15,9): | 0.2114 | |
| Courbe Coppock: | 10.17 |
| MA7: | 2.1185 | |
| MA20: | 2.0495 | |
| MA50: | 2.0190 | |
| MA100: | 1.7970 | |
| MAexp7: | 2.1112 | |
| MAexp20: | 2.0621 | |
| MAexp50: | 1.9764 | |
| MAexp100: | 1.8179 | |
| Price / MA7: | +0.40% | |
| Price / MA20: | +3.78% | |
| Price / MA50: | +5.34% | |
| Price / MA100: | +18.36% | |
| Price / MAexp7: | +0.74% | |
| Price / MAexp20: | +3.14% | |
| Price / MAexp50: | +7.61% | |
| Price / MAexp100: | +17.00% |
About author

Online


Add a comment
Comments
0 comments on the analysis GASOL - Daily