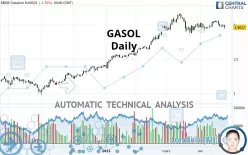
GASOL - Daily - Technical analysis published on 04/26/2021 (GMT)
- 154
- 0
Click here for a new analysis!
- Timeframe : Daily
- - Analysis generated on
- Status : TARGET REACHED

Summary of the analysis

Additional analysis
Quotes
The GASOL rating is 1.9617 USD. The price registered a decrease of -1.70% on the session and was between 1.9409 USD and 1.9984 USD. This implies that the price is at +1.07% from its lowest and at -1.84% from its highest.The Central Gaps scanner detects a bearish opening marking the presence of sellers ahead of buyers at the opening but not sufficiently marked to allow the price to register a quotation gap.
Bearish opening
Type : Bearish
Timeframe : Openning
Here is a more detailed summary of the historical variations registered by GASOL:
Technical
A technical analysis in Daily of this GASOL chart shows a bullish trend. 67.86% of the signals given by moving averages are bullish. Caution: the slightly bearish signals currently being given by short-term moving averages indicate that this bullish trend may be running out of steam. The Central Indicators market scanner is currently detecting several bearish signals that could impact this trend:
Bearish price crossover with Moving Average 20
Type : Bearish
Timeframe : Daily
Bearish price crossover with Moving Average 50
Type : Bearish
Timeframe : Daily
Bearish price crossover with adaptative moving average 100
Type : Bearish
Timeframe : Daily
In fact, Central Analyzer took into account 18 technical indicators and the result was as follows: 4 are bullish, 8 are neutral and 6 are bearish. Other results related to technical indicators were also found by the Central Indicators scanner:
Pivot points : price is under support 1
Type : Neutral
Timeframe : Daily
RSI indicator is back under 50
Type : Bearish
Timeframe : Daily
Parabolic SAR indicator bearish reversal
Type : Bearish
Timeframe : Daily
Price is back over the pivot point
Type : Bullish
Timeframe : Daily
Price is back under the pivot point
Type : Bearish
Timeframe : Weekly
Momentum indicator is back under 0
Type : Bearish
Timeframe : Daily
Williams %R indicator is back under -50
Type : Bearish
Timeframe : Daily
The analysis of the price chart with Central Patterns scanners does not return any result.
No result was found by the Central Candlesticks scanner on Japanese candlesticks.
| S3 | S2 | S1 | Price | R1 | R2 | R3 | |
|---|---|---|---|---|---|---|---|
| ProTrendLines | 1.5535 | 1.8436 | 1.9527 | 1.9617 | 2.0518 | 2.1500 | 2.2702 |
| Change (%) | -20.81% | -6.02% | -0.46% | - | +4.59% | +9.60% | +15.73% |
| Change | -0.4082 | -0.1181 | -0.0090 | - | +0.0901 | +0.1883 | +0.3085 |
| Level | Minor | Intermediate | Major | - | Minor | Intermediate | Intermediate |
Attention could also be paid to pivot points to set price objectives:
| Pivot points | S3 | S2 | S1 | PP | R1 | R2 | R3 |
|---|---|---|---|---|---|---|---|
| Standard | 1.9430 | 1.9565 | 1.9761 | 1.9896 | 2.0092 | 2.0227 | 2.0423 |
| Camarilla | 1.9866 | 1.9896 | 1.9927 | 1.9957 | 1.9987 | 2.0018 | 2.0048 |
| Woodie | 1.9461 | 1.9580 | 1.9792 | 1.9911 | 2.0123 | 2.0242 | 2.0454 |
| Fibonacci | 1.9565 | 1.9691 | 1.9770 | 1.9896 | 2.0022 | 2.0101 | 2.0227 |
| Pivot points | S3 | S2 | S1 | PP | R1 | R2 | R3 |
|---|---|---|---|---|---|---|---|
| Standard | 1.8358 | 1.8983 | 1.9470 | 2.0095 | 2.0582 | 2.1207 | 2.1694 |
| Camarilla | 1.9651 | 1.9753 | 1.9855 | 1.9957 | 2.0059 | 2.0161 | 2.0263 |
| Woodie | 1.8289 | 1.8949 | 1.9401 | 2.0061 | 2.0513 | 2.1173 | 2.1625 |
| Fibonacci | 1.8983 | 1.9408 | 1.9670 | 2.0095 | 2.0520 | 2.0782 | 2.1207 |
| Pivot points | S3 | S2 | S1 | PP | R1 | R2 | R3 |
|---|---|---|---|---|---|---|---|
| Standard | 1.5730 | 1.7220 | 1.8721 | 2.0211 | 2.1712 | 2.3202 | 2.4703 |
| Camarilla | 1.9401 | 1.9675 | 1.9949 | 2.0223 | 2.0497 | 2.0771 | 2.1046 |
| Woodie | 1.5737 | 1.7223 | 1.8728 | 2.0214 | 2.1719 | 2.3205 | 2.4710 |
| Fibonacci | 1.7220 | 1.8362 | 1.9068 | 2.0211 | 2.1353 | 2.2059 | 2.3202 |
Numerical data
The following is the status of technical indicators and moving averages registered at the time this technical analysis was created:
| RSI (14): | 47.08 | |
| MACD (12,26,9): | 0.0106 | |
| Directional Movement: | -5.0908 | |
| AROON (14): | 64.2857 | |
| DEMA (21): | 2.0091 | |
| Parabolic SAR (0,02-0,02-0,2): | 2.0720 | |
| Elder Ray (13): | -0.0239 | |
| Super Trend (3,10): | 2.1250 | |
| Zig ZAG (10): | 1.9617 | |
| VORTEX (21): | 1.0335 | |
| Stochastique (14,3,5): | 38.99 | |
| TEMA (21): | 1.9823 | |
| Williams %R (14): | -74.66 | |
| Chande Momentum Oscillator (20): | -0.0031 | |
| Repulse (5,40,3): | -2.2366 | |
| ROCnROLL: | -1 | |
| TRIX (15,9): | 0.1041 | |
| Courbe Coppock: | 2.56 |
| MA7: | 2.0020 | |
| MA20: | 1.9913 | |
| MA50: | 1.9705 | |
| MA100: | 1.7235 | |
| MAexp7: | 1.9896 | |
| MAexp20: | 1.9904 | |
| MAexp50: | 1.9197 | |
| MAexp100: | 1.7608 | |
| Price / MA7: | -2.01% | |
| Price / MA20: | -1.49% | |
| Price / MA50: | -0.45% | |
| Price / MA100: | +13.82% | |
| Price / MAexp7: | -1.40% | |
| Price / MAexp20: | -1.44% | |
| Price / MAexp50: | +2.19% | |
| Price / MAexp100: | +11.41% |
About author

Online


Add a comment
Comments
0 comments on the analysis GASOL - Daily