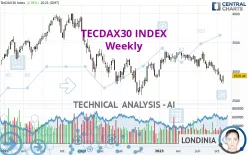
TECDAX30 INDEX - Weekly - Technical analysis published on 11/02/2023 (GMT)
- 141
- 0
Click here for a new analysis!
- Timeframe : Weekly
- - Analysis generated on
- Status : INVALID

Summary of the analysis

Additional analysis
Quotes
TECDAX30 INDEX rating 2,928.44 EUR. The price is up +3.32% over 5 days and has been traded over the last 5 days between 2,788.38 EUR and 2,929.20 EUR. This implies that the 5 day price is +5.02% from its lowest point and -0.03% from its highest point.A bullish gap was detected at the opening by the Central Gaps scanner. There are a lot of buyers and they have the upper hand in the very short term.
Opening Gap UP
Type : Bullish
Timeframe : Openning
A study of price movements over other periods shows the following variations:
Near a new LOW record (1 year)
Type : Bearish
Timeframe : Weekly
Near a new LOW record (1st january)
Type : Bearish
Timeframe : Weekly
Near a new HIGH record (1 month)
Type : Bullish
Timeframe : Weekly
Technical
A technical analysis in Weekly of this TECDAX30 INDEX chart shows a sharp bearish trend. The signals given by moving averages are 89.29% bearish. This strong bearish trend is confirmed by the strong signals currently being given by short-term moving averages. The Central Indicators market scanner is currently detecting several bearish and bullish signals that could impact this trend:
Bearish trend reversal : Moving Average 50
Type : Bearish
Timeframe : Weekly
Moving Average bullish crossovers : MA50 & MA100
Type : Bullish
Timeframe : Weekly
In fact, of the 18 technical indicators analysed by Central Analyzer, 5 are bullish, 3 are neutral and 10 are bearish. Caution: the Central Indicators scanner currently detects an excess:
CCI indicator is oversold : under -100
Type : Neutral
Timeframe : Weekly
Previous candle closed under Bollinger bands
Type : Neutral
Timeframe : Weekly
Pivot points : price is over resistance 2
Type : Neutral
Timeframe : Weekly
No signals are given by Central Patterns, a market scanner specialised in chart patterns, resistances and supports.
The Central Candlesticks scanner which studies Japanese candlesticks did not detect anything.
| S3 | S2 | S1 | Price | R1 | R2 | R3 | |
|---|---|---|---|---|---|---|---|
| ProTrendLines | 2,202.23 | 2,611.41 | 2,813.38 | 2,928.44 | 3,039.48 | 3,338.57 | 3,583.38 |
| Change (%) | -24.80% | -10.83% | -3.93% | - | +3.79% | +14.01% | +22.36% |
| Change | -726.21 | -317.03 | -115.06 | - | +111.04 | +410.13 | +654.94 |
| Level | Major | Major | Major | - | Minor | Major | Minor |
Pivot points can also be used to set your price objectives. Here is the price situation in relation to pivot points:
| Pivot points | S3 | S2 | S1 | PP | R1 | R2 | R3 |
|---|---|---|---|---|---|---|---|
| Standard | 2,815.11 | 2,825.89 | 2,843.54 | 2,854.32 | 2,871.97 | 2,882.75 | 2,900.40 |
| Camarilla | 2,853.38 | 2,855.99 | 2,858.59 | 2,861.20 | 2,863.81 | 2,866.41 | 2,869.02 |
| Woodie | 2,818.56 | 2,827.61 | 2,846.99 | 2,856.04 | 2,875.42 | 2,884.47 | 2,903.85 |
| Fibonacci | 2,825.89 | 2,836.75 | 2,843.46 | 2,854.32 | 2,865.18 | 2,871.89 | 2,882.75 |
| Pivot points | S3 | S2 | S1 | PP | R1 | R2 | R3 |
|---|---|---|---|---|---|---|---|
| Standard | 2,706.77 | 2,751.69 | 2,788.68 | 2,833.60 | 2,870.59 | 2,915.51 | 2,952.50 |
| Camarilla | 2,803.15 | 2,810.65 | 2,818.16 | 2,825.67 | 2,833.18 | 2,840.69 | 2,848.20 |
| Woodie | 2,702.81 | 2,749.71 | 2,784.72 | 2,831.62 | 2,866.63 | 2,913.53 | 2,948.54 |
| Fibonacci | 2,751.69 | 2,782.98 | 2,802.31 | 2,833.60 | 2,864.89 | 2,884.22 | 2,915.51 |
| Pivot points | S3 | S2 | S1 | PP | R1 | R2 | R3 |
|---|---|---|---|---|---|---|---|
| Standard | 2,464.16 | 2,626.27 | 2,735.66 | 2,897.77 | 3,007.16 | 3,169.27 | 3,278.66 |
| Camarilla | 2,770.39 | 2,795.28 | 2,820.16 | 2,845.05 | 2,869.94 | 2,894.83 | 2,919.71 |
| Woodie | 2,437.80 | 2,613.09 | 2,709.30 | 2,884.59 | 2,980.80 | 3,156.09 | 3,252.30 |
| Fibonacci | 2,626.27 | 2,729.98 | 2,794.06 | 2,897.77 | 3,001.48 | 3,065.56 | 3,169.27 |
Numerical data
The following is the status of the technical indicators and moving averages at the time of publication of this technical analysis:
| RSI (14): | 40.14 | |
| MACD (12,26,9): | -78.0100 | |
| Directional Movement: | -13.50 | |
| AROON (14): | -100.00 | |
| DEMA (21): | 2,959.97 | |
| Parabolic SAR (0,02-0,02-0,2): | 3,141.16 | |
| Elder Ray (13): | -143.08 | |
| Super Trend (3,10): | 3,158.13 | |
| Zig ZAG (10): | 2,924.08 | |
| VORTEX (21): | 0.8300 | |
| Stochastique (14,3,5): | 10.18 | |
| TEMA (21): | 2,888.36 | |
| Williams %R (14): | -75.14 | |
| Chande Momentum Oscillator (20): | -203.59 | |
| Repulse (5,40,3): | 1.0500 | |
| ROCnROLL: | 2 | |
| TRIX (15,9): | -0.2200 | |
| Courbe Coppock: | 15.49 |
| MA7: | 2,846.84 | |
| MA20: | 2,910.44 | |
| MA50: | 3,004.00 | |
| MA100: | 3,088.43 | |
| MAexp7: | 2,939.93 | |
| MAexp20: | 3,046.63 | |
| MAexp50: | 3,113.02 | |
| MAexp100: | 3,153.36 | |
| Price / MA7: | +2.87% | |
| Price / MA20: | +0.62% | |
| Price / MA50: | -2.52% | |
| Price / MA100: | -5.18% | |
| Price / MAexp7: | -0.39% | |
| Price / MAexp20: | -3.88% | |
| Price / MAexp50: | -5.93% | |
| Price / MAexp100: | -7.13% |
About author

Online


Add a comment
Comments
0 comments on the analysis TECDAX30 INDEX - Weekly