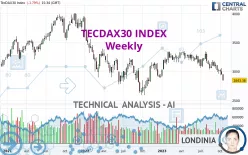
TECDAX30 INDEX - Weekly - Technical analysis published on 10/21/2023 (GMT)
- 192
- 0
Click here for a new analysis!
- Timeframe : Weekly
- - Analysis generated on
- Status : INVALID

Summary of the analysis

Additional analysis
Quotes
TECDAX30 INDEX rating 2,843.38 EUR. Over 5 days, this instrument lost -3.52% and has been traded over the last 5 days between 2,841.40 EUR and 2,952.61 EUR. This implies that the 5 day price is +0.07% from its lowest point and -3.70% from its highest point.The Central Gaps scanner detects the formation of a bearish gap marking the strong presence of sellers ahead of buyers at the opening. This formed a quotation gap.
Opening Gap DOWN
Type : Bearish
Timeframe : Openning
Here is a more detailed summary of the historical variations registered by TECDAX30 INDEX:
Near a new LOW record (1 year)
Type : Bearish
Timeframe : Weekly
New LOW record (1st january)
Type : Bearish
Timeframe : Weekly
New LOW record (1 month)
Type : Bearish
Timeframe : Weekly
Technical
Technical analysis of TECDAX30 INDEX in Weekly shows a overall strongly bearish trend. The signals given by moving averages are 85.71% bearish. This strong bearish trend is confirmed by the strong signals currently being given by short-term moving averages. An assessment of moving averages reveals a bearish signal that could impact this trend:
Moving Average bearish crossovers : AMA20 & AMA50
Type : Bearish
Timeframe : Weekly
In fact, according to the parameters integrated into the Central Analyzer system, 14 technical indicators out of 18 analysed are currently bearish. Caution: the Central Indicators scanner currently detects an excess:
CCI indicator is oversold : under -100
Type : Neutral
Timeframe : Weekly
Williams %R indicator is oversold : under -80
Type : Neutral
Timeframe : Weekly
Pivot points : price is under support 3
Type : Neutral
Timeframe : Weekly
The analysis of the price chart with Central Patterns scanners does not return any result.
The Central Candlesticks scanner, specialised in Japanese candlesticks, did not identify any signals.
| S3 | S2 | S1 | Price | R1 | R2 | R3 | |
|---|---|---|---|---|---|---|---|
| ProTrendLines | 2,202.23 | 2,611.41 | 2,813.38 | 2,843.38 | 3,039.48 | 3,338.57 | 3,583.38 |
| Change (%) | -22.55% | -8.16% | -1.06% | - | +6.90% | +17.42% | +26.03% |
| Change | -641.15 | -231.97 | -30.00 | - | +196.10 | +495.19 | +740.00 |
| Level | Major | Major | Intermediate | - | Major | Major | Minor |
Attention could also be paid to pivot points to set price objectives:
| Pivot points | S3 | S2 | S1 | PP | R1 | R2 | R3 |
|---|---|---|---|---|---|---|---|
| Standard | 2,788.31 | 2,814.85 | 2,829.12 | 2,855.66 | 2,869.93 | 2,896.47 | 2,910.74 |
| Camarilla | 2,832.16 | 2,835.90 | 2,839.64 | 2,843.38 | 2,847.12 | 2,850.86 | 2,854.60 |
| Woodie | 2,782.17 | 2,811.78 | 2,822.98 | 2,852.59 | 2,863.79 | 2,893.40 | 2,904.60 |
| Fibonacci | 2,814.85 | 2,830.44 | 2,840.07 | 2,855.66 | 2,871.25 | 2,880.88 | 2,896.47 |
| Pivot points | S3 | S2 | S1 | PP | R1 | R2 | R3 |
|---|---|---|---|---|---|---|---|
| Standard | 2,797.08 | 2,872.16 | 2,909.71 | 2,984.79 | 3,022.34 | 3,097.42 | 3,134.97 |
| Camarilla | 2,916.28 | 2,926.60 | 2,936.93 | 2,947.25 | 2,957.57 | 2,967.90 | 2,978.22 |
| Woodie | 2,778.31 | 2,862.78 | 2,890.94 | 2,975.41 | 3,003.57 | 3,088.04 | 3,116.20 |
| Fibonacci | 2,872.16 | 2,915.19 | 2,941.77 | 2,984.79 | 3,027.82 | 3,054.40 | 3,097.42 |
| Pivot points | S3 | S2 | S1 | PP | R1 | R2 | R3 |
|---|---|---|---|---|---|---|---|
| Standard | 2,700.94 | 2,830.26 | 2,925.02 | 3,054.34 | 3,149.10 | 3,278.42 | 3,373.18 |
| Camarilla | 2,958.16 | 2,978.70 | 2,999.24 | 3,019.78 | 3,040.32 | 3,060.86 | 3,081.40 |
| Woodie | 2,683.66 | 2,821.62 | 2,907.74 | 3,045.70 | 3,131.82 | 3,269.78 | 3,355.90 |
| Fibonacci | 2,830.26 | 2,915.86 | 2,968.74 | 3,054.34 | 3,139.94 | 3,192.82 | 3,278.42 |
Numerical data
The following is the status of technical indicators and moving averages registered at the time this technical analysis was created:
| RSI (14): | 32.62 | |
| MACD (12,26,9): | -65.3500 | |
| Directional Movement: | -16.19 | |
| AROON (14): | -85.71 | |
| DEMA (21): | 3,015.04 | |
| Parabolic SAR (0,02-0,02-0,2): | 3,226.67 | |
| Elder Ray (13): | -147.82 | |
| Super Trend (3,10): | 3,225.89 | |
| Zig ZAG (10): | 2,843.38 | |
| VORTEX (21): | 0.8400 | |
| Stochastique (14,3,5): | 6.48 | |
| TEMA (21): | 2,947.27 | |
| Williams %R (14): | -99.60 | |
| Chande Momentum Oscillator (20): | -459.15 | |
| Repulse (5,40,3): | -7.8900 | |
| ROCnROLL: | 2 | |
| TRIX (15,9): | -0.1500 | |
| Courbe Coppock: | 12.80 |
| MA7: | 2,930.65 | |
| MA20: | 2,971.28 | |
| MA50: | 3,048.97 | |
| MA100: | 3,122.48 | |
| MAexp7: | 2,985.05 | |
| MAexp20: | 3,083.94 | |
| MAexp50: | 3,132.78 | |
| MAexp100: | 3,164.44 | |
| Price / MA7: | -2.98% | |
| Price / MA20: | -4.30% | |
| Price / MA50: | -6.74% | |
| Price / MA100: | -8.94% | |
| Price / MAexp7: | -4.75% | |
| Price / MAexp20: | -7.80% | |
| Price / MAexp50: | -9.24% | |
| Price / MAexp100: | -10.15% |
About author

Online


Add a comment
Comments
0 comments on the analysis TECDAX30 INDEX - Weekly