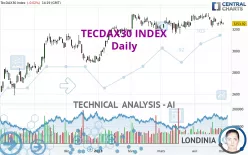
TECDAX30 INDEX - Daily - Technical analysis published on 05/03/2023 (GMT)
- 171
- 0
Click here for a new analysis!
- Timeframe : Daily
- - Analysis generated on
- Status : TARGET REACHED

Summary of the analysis

Additional analysis
Quotes
TECDAX30 INDEX rating 3,253.92 EUR. The price registered a decrease of -0.02% on the session and was between 3,242.30 EUR and 3,264.40 EUR. This implies that the price is at +0.36% from its lowest and at -0.32% from its highest.The Central Gaps scanner detects a bullish opening. A small advantage for buyers in the very short term.
Bullish opening
Type : Bullish
Timeframe : Openning
Here is a more detailed summary of the historical variations registered by TECDAX30 INDEX:
Near a new HIGH record (1 year)
Type : Bullish
Timeframe : Weekly
Near a new HIGH record (1st january)
Type : Bullish
Timeframe : Weekly
Near a new HIGH record (1 month)
Type : Bullish
Timeframe : Weekly
Technical
Technical analysis of this Daily chart of TECDAX30 INDEX indicates that the overall trend is not clearly defined. The strong bearish signals currently being given by short-term moving averages could allow the overall trend to return to a bearish trend. The Central Indicators scanner detects a bearish signal on moving averages that could impact this trend:
Bearish trend reversal : Moving Average 20
Type : Bearish
Timeframe : Daily
In fact, only 8 technical indicators out of 18 studied are currently bearish. Caution: the Central Indicators scanner currently detects an excess:
CCI indicator is oversold : under -100
Type : Neutral
Timeframe : Daily
The analysis of the price chart with Central Patterns scanners does not return any result.
The Central Candlesticks scanner which studies Japanese candlesticks did not detect anything.
| S3 | S2 | S1 | Price | R1 | R2 | R3 | |
|---|---|---|---|---|---|---|---|
| ProTrendLines | 2,897.54 | 3,033.92 | 3,199.76 | 3,253.92 | 3,289.45 | 3,590.41 | 3,752.95 |
| Change (%) | -10.95% | -6.76% | -1.66% | - | +1.09% | +10.34% | +15.34% |
| Change | -356.38 | -220.00 | -54.16 | - | +35.53 | +336.49 | +499.03 |
| Level | Intermediate | Minor | Intermediate | - | Major | Intermediate | Minor |
Attention could also be paid to pivot points to set price objectives:
| Pivot points | S3 | S2 | S1 | PP | R1 | R2 | R3 |
|---|---|---|---|---|---|---|---|
| Standard | 3,197.41 | 3,224.66 | 3,239.57 | 3,266.82 | 3,281.73 | 3,308.98 | 3,323.89 |
| Camarilla | 3,242.90 | 3,246.76 | 3,250.63 | 3,254.49 | 3,258.36 | 3,262.22 | 3,266.08 |
| Woodie | 3,191.25 | 3,221.58 | 3,233.41 | 3,263.74 | 3,275.57 | 3,305.90 | 3,317.73 |
| Fibonacci | 3,224.66 | 3,240.76 | 3,250.71 | 3,266.82 | 3,282.92 | 3,292.87 | 3,308.98 |
| Pivot points | S3 | S2 | S1 | PP | R1 | R2 | R3 |
|---|---|---|---|---|---|---|---|
| Standard | 3,143.28 | 3,187.68 | 3,228.26 | 3,272.66 | 3,313.24 | 3,357.64 | 3,398.22 |
| Camarilla | 3,245.47 | 3,253.26 | 3,261.05 | 3,268.84 | 3,276.63 | 3,284.42 | 3,292.21 |
| Woodie | 3,141.37 | 3,186.73 | 3,226.35 | 3,271.71 | 3,311.33 | 3,356.69 | 3,396.31 |
| Fibonacci | 3,187.68 | 3,220.14 | 3,240.20 | 3,272.66 | 3,305.12 | 3,325.18 | 3,357.64 |
| Pivot points | S3 | S2 | S1 | PP | R1 | R2 | R3 |
|---|---|---|---|---|---|---|---|
| Standard | 3,076.65 | 3,147.73 | 3,208.29 | 3,279.37 | 3,339.93 | 3,411.01 | 3,471.57 |
| Camarilla | 3,232.64 | 3,244.71 | 3,256.77 | 3,268.84 | 3,280.91 | 3,292.97 | 3,305.04 |
| Woodie | 3,071.38 | 3,145.10 | 3,203.02 | 3,276.74 | 3,334.66 | 3,408.38 | 3,466.30 |
| Fibonacci | 3,147.73 | 3,198.02 | 3,229.09 | 3,279.37 | 3,329.66 | 3,360.73 | 3,411.01 |
Numerical data
The following are the details of the technical indicators and moving averages that were collected to generate this technical analysis:
| RSI (14): | 45.79 | |
| MACD (12,26,9): | -2.8300 | |
| Directional Movement: | -0.99 | |
| AROON (14): | -28.57 | |
| DEMA (21): | 3,274.60 | |
| Parabolic SAR (0,02-0,02-0,2): | 3,300.47 | |
| Elder Ray (13): | -17.96 | |
| Super Trend (3,10): | 3,210.34 | |
| Zig ZAG (10): | 3,249.61 | |
| VORTEX (21): | 0.9400 | |
| Stochastique (14,3,5): | 29.26 | |
| TEMA (21): | 3,260.22 | |
| Williams %R (14): | -77.36 | |
| Chande Momentum Oscillator (20): | -67.08 | |
| Repulse (5,40,3): | -0.7700 | |
| ROCnROLL: | -1 | |
| TRIX (15,9): | 0.0200 | |
| Courbe Coppock: | 2.85 |
| MA7: | 3,264.62 | |
| MA20: | 3,288.41 | |
| MA50: | 3,261.56 | |
| MA100: | 3,190.15 | |
| MAexp7: | 3,262.33 | |
| MAexp20: | 3,274.25 | |
| MAexp50: | 3,255.48 | |
| MAexp100: | 3,198.96 | |
| Price / MA7: | -0.33% | |
| Price / MA20: | -1.05% | |
| Price / MA50: | -0.23% | |
| Price / MA100: | +2.00% | |
| Price / MAexp7: | -0.26% | |
| Price / MAexp20: | -0.62% | |
| Price / MAexp50: | -0.05% | |
| Price / MAexp100: | +1.72% |
About author
Online


Add a comment
Comments
0 comments on the analysis TECDAX30 INDEX - Daily