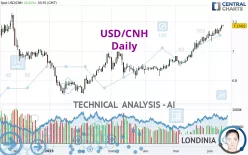
USD/CNH - Daily - Technical analysis published on 06/14/2023 (GMT)
- 211
- 0
Click here for a new analysis!
- Timeframe : Daily
- - Analysis generated on
- Status : TARGET REACHED

Summary of the analysis

Additional analysis
Quotes
The USD/CNH rating is 7.17395 CNH. On the day, this instrument gained +0.00% and was between 7.16596 CNH and 7.17876 CNH. This implies that the price is at +0.11% from its lowest and at -0.07% from its highest.The Central Gaps scanner detects a bearish opening. A small advantage for sellers in the very short term.
Bearish opening
Type : Bearish
Timeframe : Openning
A study of price movements over other periods shows the following variations:
Near a new HIGH record (5 years)
Type : Bullish
Timeframe : Weekly
Near a new HIGH record (1 year)
Type : Bullish
Timeframe : Weekly
Near a new HIGH record (1st january)
Type : Bullish
Timeframe : Weekly
Near a new LOW record (1 month)
Type : Bearish
Timeframe : Weekly
Technical
Technical analysis of USD/CNH in Daily shows a strongly overall bullish trend. 92.86% of the signals given by moving averages are bullish. The overall trend is supported by the strong bullish signals from short-term moving averages. The Central Indicators scanner does not detect any result on moving averages that would impact this trend.
The probability of a further increase is high given the direction of the technical indicators.
But beware of excesses. The Central Indicators scanner currently detects this:
RSI indicator is overbought : over 70
Type : Neutral
Timeframe : Daily
CCI indicator is overbought : over 100
Type : Neutral
Timeframe : Daily
Williams %R indicator is overbought : over -20
Type : Neutral
Timeframe : Daily
Pivot points : price is over resistance 1
Type : Neutral
Timeframe : Weekly
The Central Patterns scanner, which studies chart patterns, resistances and supports, has identified these signals:
Near horizontal resistance
Type : Bearish
Timeframe : Daily
Resistance of channel is broken
Type : Bullish
Timeframe : Daily
Central Candlesticks, the scanner specialised in Japanese candlesticks, detects these signals that could have an impact on the current short-term trend:
Bearish harami
Type : Bearish
Timeframe : Daily
Doji
Type : Neutral
Timeframe : Daily
| S3 | S2 | S1 | Price | R1 | R2 | R3 | |
|---|---|---|---|---|---|---|---|
| ProTrendLines | 6.83564 | 6.98157 | 7.09412 | 7.17395 | 7.19041 | 7.24632 | 7.34266 |
| Change (%) | -4.72% | -2.68% | -1.11% | - | +0.23% | +1.01% | +2.35% |
| Change | -0.33831 | -0.19238 | -0.07983 | - | +0.01646 | +0.07237 | +0.16871 |
| Level | Minor | Major | Minor | - | Major | Minor | Major |
To determine price objectives, it is also possible to use the pivot points. Here is the price position in relation to pivot points:
| Pivot points | S3 | S2 | S1 | PP | R1 | R2 | R3 |
|---|---|---|---|---|---|---|---|
| Standard | 7.12486 | 7.13667 | 7.15527 | 7.16708 | 7.18568 | 7.19749 | 7.21609 |
| Camarilla | 7.16550 | 7.16829 | 7.17107 | 7.17386 | 7.17665 | 7.17944 | 7.18222 |
| Woodie | 7.12825 | 7.13837 | 7.15866 | 7.16878 | 7.18907 | 7.19919 | 7.21948 |
| Fibonacci | 7.13667 | 7.14829 | 7.15547 | 7.16708 | 7.17870 | 7.18588 | 7.19749 |
| Pivot points | S3 | S2 | S1 | PP | R1 | R2 | R3 |
|---|---|---|---|---|---|---|---|
| Standard | 7.06070 | 7.08197 | 7.11316 | 7.13443 | 7.16562 | 7.18689 | 7.21808 |
| Camarilla | 7.12991 | 7.13472 | 7.13953 | 7.14434 | 7.14915 | 7.15396 | 7.15877 |
| Woodie | 7.06565 | 7.08445 | 7.11811 | 7.13691 | 7.17057 | 7.18937 | 7.22303 |
| Fibonacci | 7.08197 | 7.10201 | 7.11439 | 7.13443 | 7.15447 | 7.16685 | 7.18689 |
| Pivot points | S3 | S2 | S1 | PP | R1 | R2 | R3 |
|---|---|---|---|---|---|---|---|
| Standard | 6.72621 | 6.81123 | 6.96430 | 7.04932 | 7.20239 | 7.28741 | 7.44048 |
| Camarilla | 7.05189 | 7.07371 | 7.09554 | 7.11736 | 7.13919 | 7.16101 | 7.18284 |
| Woodie | 6.76023 | 6.82824 | 6.99832 | 7.06633 | 7.23641 | 7.30442 | 7.47450 |
| Fibonacci | 6.81123 | 6.90218 | 6.95837 | 7.04932 | 7.14027 | 7.19646 | 7.28741 |
Numerical data
The following is the status of the technical indicators and moving averages at the time of publication of this technical analysis:
| RSI (14): | 74.06 | |
| MACD (12,26,9): | 0.0497 | |
| Directional Movement: | 21.90621 | |
| AROON (14): | 85.71428 | |
| DEMA (21): | 7.16709 | |
| Parabolic SAR (0,02-0,02-0,2): | 7.09707 | |
| Elder Ray (13): | 0.04505 | |
| Super Trend (3,10): | 7.07433 | |
| Zig ZAG (10): | 7.17302 | |
| VORTEX (21): | 1.2746 | |
| Stochastique (14,3,5): | 95.92 | |
| TEMA (21): | 7.18063 | |
| Williams %R (14): | -4.26 | |
| Chande Momentum Oscillator (20): | 0.08648 | |
| Repulse (5,40,3): | 0.5218 | |
| ROCnROLL: | 1 | |
| TRIX (15,9): | 0.1014 | |
| Courbe Coppock: | 2.49 |
| MA7: | 7.14857 | |
| MA20: | 7.10446 | |
| MA50: | 6.99341 | |
| MA100: | 6.92951 | |
| MAexp7: | 7.15040 | |
| MAexp20: | 7.10136 | |
| MAexp50: | 7.02519 | |
| MAexp100: | 6.97501 | |
| Price / MA7: | +0.36% | |
| Price / MA20: | +0.98% | |
| Price / MA50: | +2.58% | |
| Price / MA100: | +3.53% | |
| Price / MAexp7: | +0.33% | |
| Price / MAexp20: | +1.02% | |
| Price / MAexp50: | +2.12% | |
| Price / MAexp100: | +2.85% |
News
The last news published on USD/CNH at the time of the generation of this analysis was as follows:
-
 Trade of the Week - Monday 21/11/22: long USD/CNH
-
USDCNH Extends Dive While S&P 500 and Dollar Await an Unreliable Fed Signal
-
Dollar May Await Fed Before Leaning Into Trend, But USDCNH Is Actively Dropping
-
Why Aren't AAPL and GM Shares, USDCNH, Fed Rate Forecasts Lower on Trump's Threats?
-
Technical Focus: Honing in on a Major USD/CNH Level
About author
Online


Add a comment
Comments
0 comments on the analysis USD/CNH - Daily