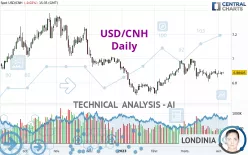
USD/CNH - Daily - Technical analysis published on 04/06/2023 (GMT)
- 163
- 0
- Who voted?
- Timeframe : Daily
- - Analysis generated on
- Status : NEUTRAL

Summary of the analysis

Additional analysis
Quotes
The USD/CNH rating is 6.88405 CNH. The price registered a decrease of -0.02% on the session with the lowest point at 6.87050 CNH and the highest point at 6.88851 CNH. The deviation from the price is +0.20% for the low point and -0.06% for the high point.A bullish opening was detected by the Central Gaps scanner. Buyers are trying to impose a bullish momentum in the very short term.
Bullish opening
Type : Bullish
Timeframe : Openning
So that you have an overall view of the price change, here is a table showing the variations over several periods:
Near a new LOW record (1st january)
Type : Bearish
Timeframe : Weekly
Near a new HIGH record (1 month)
Type : Bullish
Timeframe : Weekly
Technical
A technical analysis in Daily of this USD/CNH chart shows a slightly bearish trend. 60.71% of the signals given by moving averages are bearish. Caution: the slightly bullish signals currently given by short-term moving averages could cause a reversal of the trend. An assessment of moving averages reveals a bullish signal that could impact this trend:
Bullish trend reversal : adaptative moving average 20
Type : Bullish
Timeframe : Daily
In fact, only 9 technical indicators out of 18 studied are currently bullish. Central Indicators, the detector scanner for these technical indicators recently detected a signal:
Price is back over the pivot point
Type : Bullish
Timeframe : Weekly
An analysis of the price chart with the Central Patterns scanner (detector of chart patterns and resistances and supports) shows a result that can have an impact on the price change:
Near resistance of triangle
Type : Bearish
Timeframe : Daily
No result was found by the Central Candlesticks scanner on Japanese candlesticks.
| S3 | S2 | S1 | Price | R1 | R2 | R3 | |
|---|---|---|---|---|---|---|---|
| ProTrendLines | 6.67840 | 6.78600 | 6.86652 | 6.88405 | 6.98157 | 7.19041 | 7.34266 |
| Change (%) | -2.99% | -1.42% | -0.25% | - | +1.42% | +4.45% | +6.66% |
| Change | -0.20565 | -0.09805 | -0.01753 | - | +0.09752 | +0.30636 | +0.45861 |
| Level | Major | Minor | Major | - | Major | Major | Major |
Pivot points can also be used to set your price objectives. Here is the price situation in relation to pivot points:
| Pivot points | S3 | S2 | S1 | PP | R1 | R2 | R3 |
|---|---|---|---|---|---|---|---|
| Standard | 6.84695 | 6.85494 | 6.87023 | 6.87822 | 6.89351 | 6.90150 | 6.91679 |
| Camarilla | 6.87913 | 6.88126 | 6.88340 | 6.88553 | 6.88766 | 6.88980 | 6.89193 |
| Woodie | 6.85061 | 6.85677 | 6.87389 | 6.88005 | 6.89717 | 6.90333 | 6.92045 |
| Fibonacci | 6.85494 | 6.86383 | 6.86932 | 6.87822 | 6.88711 | 6.89260 | 6.90150 |
| Pivot points | S3 | S2 | S1 | PP | R1 | R2 | R3 |
|---|---|---|---|---|---|---|---|
| Standard | 6.76967 | 6.80675 | 6.83812 | 6.87520 | 6.90657 | 6.94365 | 6.97502 |
| Camarilla | 6.85068 | 6.85695 | 6.86323 | 6.86950 | 6.87578 | 6.88205 | 6.88832 |
| Woodie | 6.76683 | 6.80532 | 6.83528 | 6.87377 | 6.90373 | 6.94222 | 6.97218 |
| Fibonacci | 6.80675 | 6.83290 | 6.84905 | 6.87520 | 6.90135 | 6.91750 | 6.94365 |
| Pivot points | S3 | S2 | S1 | PP | R1 | R2 | R3 |
|---|---|---|---|---|---|---|---|
| Standard | 6.60082 | 6.70562 | 6.78756 | 6.89236 | 6.97430 | 7.07910 | 7.16104 |
| Camarilla | 6.81815 | 6.83526 | 6.85238 | 6.86950 | 6.88662 | 6.90374 | 6.92085 |
| Woodie | 6.58939 | 6.69991 | 6.77613 | 6.88665 | 6.96287 | 7.07339 | 7.14961 |
| Fibonacci | 6.70562 | 6.77696 | 6.82103 | 6.89236 | 6.96370 | 7.00777 | 7.07910 |
Numerical data
The following is the status of the technical indicators and moving averages at the time of publication of this technical analysis:
| RSI (14): | 50.22 | |
| MACD (12,26,9): | -0.0022 | |
| Directional Movement: | -4.86560 | |
| AROON (14): | 35.71428 | |
| DEMA (21): | 6.88155 | |
| Parabolic SAR (0,02-0,02-0,2): | 6.91815 | |
| Elder Ray (13): | -0.00152 | |
| Super Trend (3,10): | 6.97571 | |
| Zig ZAG (10): | 6.88356 | |
| VORTEX (21): | 0.8865 | |
| Stochastique (14,3,5): | 69.96 | |
| TEMA (21): | 6.87400 | |
| Williams %R (14): | -27.81 | |
| Chande Momentum Oscillator (20): | 0.00849 | |
| Repulse (5,40,3): | 0.1485 | |
| ROCnROLL: | -1 | |
| TRIX (15,9): | -0.0029 | |
| Courbe Coppock: | 0.41 |
| MA7: | 6.88015 | |
| MA20: | 6.87959 | |
| MA50: | 6.86866 | |
| MA100: | 6.90519 | |
| MAexp7: | 6.87995 | |
| MAexp20: | 6.88281 | |
| MAexp50: | 6.88507 | |
| MAexp100: | 6.90168 | |
| Price / MA7: | +0.06% | |
| Price / MA20: | +0.06% | |
| Price / MA50: | +0.22% | |
| Price / MA100: | -0.31% | |
| Price / MAexp7: | +0.06% | |
| Price / MAexp20: | +0.02% | |
| Price / MAexp50: | -0.01% | |
| Price / MAexp100: | -0.26% |
News
The latest news and videos published on USD/CNH at the time of the analysis were as follows:
-
 Trade of the Week - Monday 21/11/22: long USD/CNH
-
USDCNH Extends Dive While S&P 500 and Dollar Await an Unreliable Fed Signal
-
Dollar May Await Fed Before Leaning Into Trend, But USDCNH Is Actively Dropping
-
Why Aren't AAPL and GM Shares, USDCNH, Fed Rate Forecasts Lower on Trump's Threats?
-
Technical Focus: Honing in on a Major USD/CNH Level
About author
Online


Add a comment
Comments
0 comments on the analysis USD/CNH - Daily