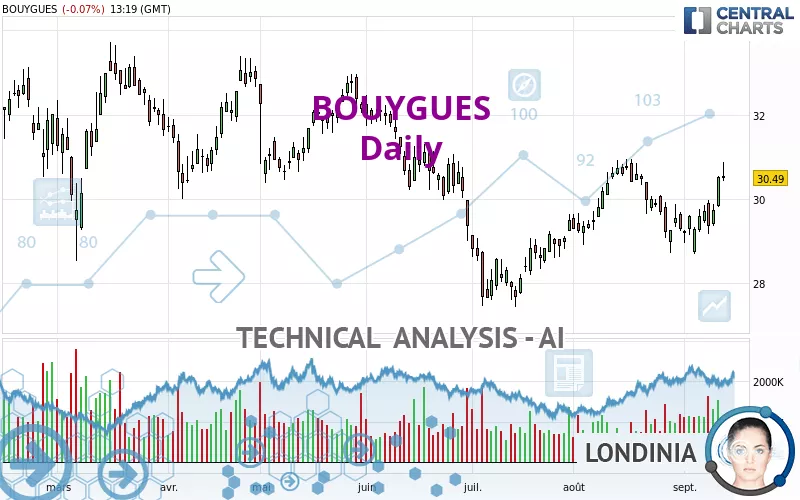
BOUYGUES - Daily - Technical analysis published on 09/13/2022 (GMT)
- 152
- 0
Click here for a new analysis!
- Timeframe : Daily
- - Analysis generated on
- Status : INVALID

Summary of the analysis

Additional analysis
Quotes
The BOUYGUES rating is 30.49 EUR. The price is lower by -0.07% since the last closing and was between 30.43 EUR and 30.87 EUR. This implies that the price is at +0.20% from its lowest and at -1.23% from its highest.A bullish opening was detected by the Central Gaps scanner. Buyers are trying to impose a bullish momentum in the very short term.
Bullish opening
Type : Bullish
Timeframe : Openning
A study of price movements over other periods shows the following variations:
Near a new HIGH record (1 month)
Type : Bullish
Timeframe : Weekly
Technical
Technical analysis of this Daily chart of BOUYGUES indicates that the overall trend is bullish. 64.29% of the signals given by moving averages are bullish. The overall trend seems to be showing some signs of weakness, as do the tentative bullish signals given by short-term moving averages. The Central Indicators market scanner is currently detecting a bullish signal that could impact this trend:
Bullish trend reversal : adaptative moving average 100
Type : Bullish
Timeframe : Daily
Technical indicators are strongly bullish, suggesting that the price increase should continue.
Caution: the Central Indicators scanner currently detects an excess:
CCI indicator is overbought : over 100
Type : Neutral
Timeframe : Daily
RSI indicator: bearish divergence
Type : Bearish
Timeframe : Daily
Williams %R indicator is overbought : over -20
Type : Neutral
Timeframe : Daily
Pivot points : price is over resistance 1
Type : Neutral
Timeframe : Weekly
Central Patterns, the market scanner focusing on chart patterns, resistances and supports found these results:
Near horizontal resistance
Type : Bearish
Timeframe : Daily
Resistance of channel is broken
Type : Bullish
Timeframe : Daily
No result was found by the Central Candlesticks scanner on Japanese candlesticks.
| S3 | S2 | S1 | Price | R1 | R2 | R3 | |
|---|---|---|---|---|---|---|---|
| ProTrendLines | 28.67 | 29.58 | 30.29 | 30.49 | 30.95 | 32.24 | 32.76 |
| Change (%) | -5.97% | -2.98% | -0.66% | - | +1.51% | +5.74% | +7.45% |
| Change | -1.82 | -0.91 | -0.20 | - | +0.46 | +1.75 | +2.27 |
| Level | Intermediate | Major | Minor | - | Major | Intermediate | Intermediate |
Pivot points can also be used to set your price objectives. Here is the price situation in relation to pivot points:
| Pivot points | S3 | S2 | S1 | PP | R1 | R2 | R3 |
|---|---|---|---|---|---|---|---|
| Standard | 29.27 | 29.54 | 30.02 | 30.29 | 30.77 | 31.04 | 31.52 |
| Camarilla | 30.30 | 30.37 | 30.44 | 30.51 | 30.58 | 30.65 | 30.72 |
| Woodie | 29.39 | 29.59 | 30.14 | 30.34 | 30.89 | 31.09 | 31.64 |
| Fibonacci | 29.54 | 29.82 | 30.00 | 30.29 | 30.57 | 30.75 | 31.04 |
| Pivot points | S3 | S2 | S1 | PP | R1 | R2 | R3 |
|---|---|---|---|---|---|---|---|
| Standard | 27.67 | 28.18 | 28.96 | 29.47 | 30.25 | 30.76 | 31.54 |
| Camarilla | 29.39 | 29.50 | 29.62 | 29.74 | 29.86 | 29.98 | 30.10 |
| Woodie | 27.81 | 28.25 | 29.10 | 29.54 | 30.39 | 30.83 | 31.68 |
| Fibonacci | 28.18 | 28.67 | 28.98 | 29.47 | 29.96 | 30.27 | 30.76 |
| Pivot points | S3 | S2 | S1 | PP | R1 | R2 | R3 |
|---|---|---|---|---|---|---|---|
| Standard | 26.15 | 27.43 | 28.37 | 29.65 | 30.59 | 31.87 | 32.81 |
| Camarilla | 28.69 | 28.89 | 29.10 | 29.30 | 29.50 | 29.71 | 29.91 |
| Woodie | 25.97 | 27.35 | 28.19 | 29.57 | 30.41 | 31.79 | 32.63 |
| Fibonacci | 27.43 | 28.28 | 28.81 | 29.65 | 30.50 | 31.03 | 31.87 |
Numerical data
The following is the status of technical indicators and moving averages registered at the time this technical analysis was created:
| RSI (14): | 59.99 | |
| MACD (12,26,9): | 0.0800 | |
| Directional Movement: | 7.47 | |
| AROON (14): | 42.86 | |
| DEMA (21): | 29.87 | |
| Parabolic SAR (0,02-0,02-0,2): | 29.01 | |
| Elder Ray (13): | 0.82 | |
| Super Trend (3,10): | 28.98 | |
| Zig ZAG (10): | 30.45 | |
| VORTEX (21): | 0.9400 | |
| Stochastique (14,3,5): | 84.83 | |
| TEMA (21): | 29.93 | |
| Williams %R (14): | -17.43 | |
| Chande Momentum Oscillator (20): | 1.27 | |
| Repulse (5,40,3): | 1.6600 | |
| ROCnROLL: | 1 | |
| TRIX (15,9): | 0.0100 | |
| Courbe Coppock: | 0.90 |
| MA7: | 29.81 | |
| MA20: | 29.79 | |
| MA50: | 29.38 | |
| MA100: | 30.24 | |
| MAexp7: | 29.97 | |
| MAexp20: | 29.79 | |
| MAexp50: | 29.78 | |
| MAexp100: | 29.96 | |
| Price / MA7: | +2.28% | |
| Price / MA20: | +2.35% | |
| Price / MA50: | +3.78% | |
| Price / MA100: | +0.83% | |
| Price / MAexp7: | +1.74% | |
| Price / MAexp20: | +2.35% | |
| Price / MAexp50: | +2.38% | |
| Price / MAexp100: | +1.77% |
News
The latest news and videos published on BOUYGUES at the time of the analysis were as follows:
- Bouygues: Monthly Disclosure of the Total Number of Shares and Voting Rights
- Bouygues: Disclosure of trading in own shares
- Bouygues: Disclosure of trading in own shares
- Bouygues: liquidity contract
- Bouygues: Monthly disclosure of the total number of shares and voting rights
About author
Online


Add a comment
Comments
0 comments on the analysis BOUYGUES - Daily