| Open: | 1.4307 |
| Change: | -0.0015 |
| Volume: | 86,358 |
| Low: | 1.4276 |
| High: | 1.4333 |
| High / Low range: | 0.0057 |
| Type: | Stocks |
| Ticker: | GPRO |
| ISIN: |
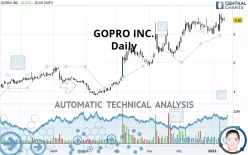
GOPRO INC. - Daily - Technical analysis published on 01/15/2021 (GMT)
- 258
- 0
- 01/15/2021 - 14:24
Click here for a new analysis!
- Timeframe : Daily
- - Analysis generated on 01/15/2021 - 14:24
- Status : TARGET REACHED

Summary of the analysis

Additional analysis
Quotes
The GOPRO INC. rating is 8.98 USD. The price registered an increase of +0.22% on the session and was between 8.92 USD and 9.22 USD. This implies that the price is at +0.67% from its lowest and at -2.60% from its highest.The Central Gaps scanner detects a bullish opening marking the presence of buyers ahead of sellers at the opening but not sufficiently marked to allow the price to register a quotation gap.
Bullish opening
Type : Bullish
Timeframe : Openning
So that you have an overall view of the price change, here is a table showing the variations over several periods:
Near a new HIGH record (1 year)
Type : Bullish
Timeframe : Weekly
Near a new HIGH record (1st january)
Type : Bullish
Timeframe : Weekly
Near a new HIGH record (1 month)
Type : Bullish
Timeframe : Weekly
Technical
A technical analysis in Daily of this GOPRO INC. chart shows a strongly bullish trend. The signals given by the moving averages are 92.86% bullish. This strong bullish trend is confirmed by the strong signals currently being given by short-term moving averages. The Central Indicators market scanner currently does not detect any result that concerns moving averages.
In fact, according to the parameters integrated into the Central Analyzer system, 13 technical indicators out of 18 analysed are currently bullish. Caution: the Central Indicators scanner currently detects an excess:
CCI indicator is overbought : over 100
Type : Neutral
Timeframe : Daily
Williams %R indicator is overbought : over -20
Type : Neutral
Timeframe : Daily
Pivot points : price is over resistance 1
Type : Neutral
Timeframe : Weekly
Price is back under the pivot point
Type : Bearish
Timeframe : Daily
Price is back under the pivot point
Type : Bearish
Timeframe : Weekly
An analysis of the price chart with the Central Patterns scanner (detector of chart patterns and resistances and supports) shows a result that can have an impact on the price change:
Resistance of channel is broken
Type : Bullish
Timeframe : Daily
The Central Candlesticks scanner which studies Japanese candlesticks did not detect anything.
| S3 | S2 | S1 | Price | R1 | R2 | R3 | |
|---|---|---|---|---|---|---|---|
| ProTrendLines | 4.53 | 5.63 | 7.31 | 8.98 | 9.18 | 10.67 | 11.69 |
| Change (%) | -49.55% | -37.31% | -18.60% | - | +2.23% | +18.82% | +30.18% |
| Change | -4.45 | -3.35 | -1.67 | - | +0.20 | +1.69 | +2.71 |
| Level | Major | Intermediate | Major | - | Major | Minor | Major |
Attention could also be paid to pivot points to set price objectives:
| Pivot points | S3 | S2 | S1 | PP | R1 | R2 | R3 |
|---|---|---|---|---|---|---|---|
| Standard | 8.53 | 8.68 | 8.82 | 8.97 | 9.11 | 9.26 | 9.40 |
| Camarilla | 8.88 | 8.91 | 8.93 | 8.96 | 8.99 | 9.01 | 9.04 |
| Woodie | 8.53 | 8.68 | 8.82 | 8.97 | 9.11 | 9.26 | 9.40 |
| Fibonacci | 8.68 | 8.79 | 8.86 | 8.97 | 9.08 | 9.15 | 9.26 |
| Pivot points | S3 | S2 | S1 | PP | R1 | R2 | R3 |
|---|---|---|---|---|---|---|---|
| Standard | 7.03 | 7.52 | 7.89 | 8.38 | 8.75 | 9.24 | 9.61 |
| Camarilla | 8.03 | 8.11 | 8.19 | 8.27 | 8.35 | 8.43 | 8.51 |
| Woodie | 6.98 | 7.49 | 7.84 | 8.35 | 8.70 | 9.21 | 9.56 |
| Fibonacci | 7.52 | 7.85 | 8.05 | 8.38 | 8.71 | 8.91 | 9.24 |
| Pivot points | S3 | S2 | S1 | PP | R1 | R2 | R3 |
|---|---|---|---|---|---|---|---|
| Standard | 5.08 | 6.07 | 7.18 | 8.17 | 9.28 | 10.27 | 11.38 |
| Camarilla | 7.70 | 7.90 | 8.09 | 8.28 | 8.47 | 8.67 | 8.86 |
| Woodie | 5.13 | 6.10 | 7.23 | 8.20 | 9.33 | 10.30 | 11.43 |
| Fibonacci | 6.07 | 6.88 | 7.37 | 8.17 | 8.98 | 9.47 | 10.27 |
Numerical data
The following is the status of the technical indicators and moving averages at the time of publication of this technical analysis:
| RSI (14): | 58.93 | |
| MACD (12,26,9): | 0.2600 | |
| Directional Movement: | 13.81 | |
| AROON (14): | 35.71 | |
| DEMA (21): | 8.96 | |
| Parabolic SAR (0,02-0,02-0,2): | 8.09 | |
| Elder Ray (13): | 0.35 | |
| Super Trend (3,10): | 7.62 | |
| Zig ZAG (10): | 8.98 | |
| VORTEX (21): | 1.0300 | |
| Stochastique (14,3,5): | 67.57 | |
| TEMA (21): | 8.89 | |
| Williams %R (14): | -33.33 | |
| Chande Momentum Oscillator (20): | 0.43 | |
| Repulse (5,40,3): | 0.1700 | |
| ROCnROLL: | 1 | |
| TRIX (15,9): | 0.4400 | |
| Courbe Coppock: | 4.74 |
| MA7: | 8.84 | |
| MA20: | 8.62 | |
| MA50: | 7.95 | |
| MA100: | 6.55 | |
| MAexp7: | 8.85 | |
| MAexp20: | 8.60 | |
| MAexp50: | 7.94 | |
| MAexp100: | 7.02 | |
| Price / MA7: | +1.58% | |
| Price / MA20: | +4.18% | |
| Price / MA50: | +12.96% | |
| Price / MA100: | +37.10% | |
| Price / MAexp7: | +1.47% | |
| Price / MAexp20: | +4.42% | |
| Price / MAexp50: | +13.10% | |
| Price / MAexp100: | +27.92% |
News
The latest news and videos published on GOPRO INC. at the time of the analysis were as follows:
- 01/14/2021 - 21:05 GoPro Schedules Fourth Quarter and Full Year 2020 Financial Results for February 4, 2021
- 01/13/2021 - 14:06 New GoPro Labs Firmware Launches, Unlocking Advanced Features for GoPro Cameras
- 12/17/2020 - 14:09 HERO9 Black Firmware Update Delivers New GoPro Remote Compatibility, Up to 30% Faster Content Transfer Speeds to Phones, Improved HyperSmooth 3.0 Cold Weather Performance, Slo-Mo Shortcut, External Mic Support and More
- 12/15/2020 - 14:01 GoPro Releases 2020 HERO9 Black Million Dollar Challenge Video, Announces Winners
- 12/03/2020 - 14:13 GoPro Rings in December with Subscription and Sales Milestones
About author

Online


Add a comment
Comments
0 comments on the analysis GOPRO INC. - Daily