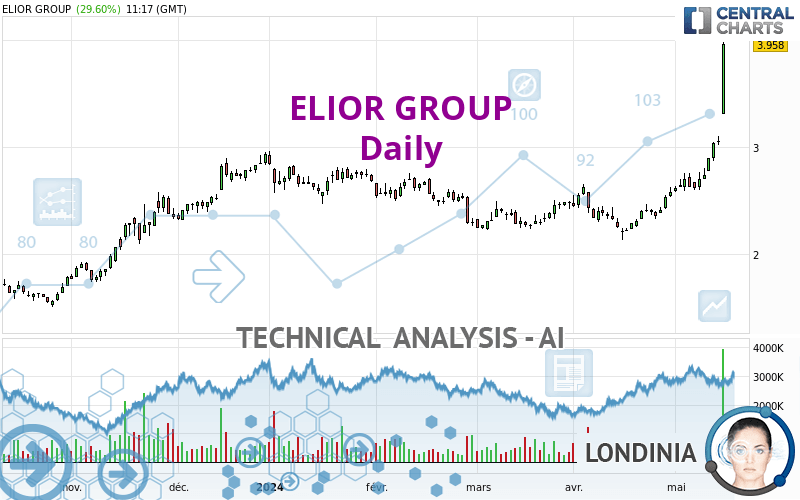
ELIOR GROUP - Daily - Technical analysis published on 05/16/2024 (GMT)
- 80
- 0
- Timeframe : Daily
- - Analysis generated on
- Status : IN PROGRESS...

Summary of the analysis

Additional analysis
Quotes
The ELIOR GROUP rating is 3.958 EUR. On the day, this instrument gained +29.60% and was traded between 3.312 EUR and 3.980 EUR over the period. The price is currently at +19.50% from its lowest and -0.55% from its highest.The Central Gaps scanner detects the formation of a bullish gap marking the strong presence of buyers against sellers at the opening. This formed a quotation gap.
Opening Gap UP
Type : Bullish
Timeframe : Openning
So that you have an overall view of the price change, here is a table showing the variations over several periods:
New HIGH record (1 year)
Type : Bullish
Timeframe : Weekly
New HIGH record (1st january)
Type : Bullish
Timeframe : Weekly
New HIGH record (1 month)
Type : Bullish
Timeframe : Weekly
Abnormal volumes on ELIOR GROUP were detected by the Central Volumes scanner:
Abnormal volumes
Timeframe : 5 days
Technical
Technical analysis of ELIOR GROUP in Daily shows a strongly overall bullish trend. The signals given by the moving averages are 89.29% bullish. This strong bullish trend is confirmed by the strong signals currently being given by short-term moving averages. There is no crossing of moving average by the price or crossing of moving averages between themselves.
An assessment of technical indicators shows a strong bullish signal.
Caution: the Central Indicators scanner currently detects an excess:
RSI indicator is overbought : over 90
Type : Neutral
Timeframe : Daily
CCI indicator is overbought : over 100
Type : Neutral
Timeframe : Daily
Williams %R indicator is overbought : over -20
Type : Neutral
Timeframe : Daily
Pivot points : price is over resistance 3
Type : Neutral
Timeframe : Daily
Pivot points : price is over resistance 3
Type : Neutral
Timeframe : Weekly
An analysis of the price chart with the Central Patterns scanner (detector of chart patterns and resistances and supports) shows a result that can have an impact on the price change:
Resistance of channel is broken
Type : Bullish
Timeframe : Daily
Central Candlesticks, the scanner specialised in Japanese candlesticks, detects these bullish signals that could support the hypothesis of a small rebound in the very short term:
White line without lower shadow
Type : Bullish
Timeframe : Daily
Upside gap
Type : Bullish
Timeframe : Daily
White marubozu
Type : Bullish
Timeframe : Daily
Long white line
Type : Bullish
Timeframe : Daily
| S3 | S2 | S1 | Price | R1 | R2 | R3 | |
|---|---|---|---|---|---|---|---|
| ProTrendLines | 2.232 | 2.625 | 2.925 | 3.958 | 4.029 | 5.980 | 7.590 |
| Change (%) | -43.61% | -33.68% | -26.10% | - | +1.79% | +51.09% | +91.76% |
| Change | -1.726 | -1.333 | -1.033 | - | +0.071 | +2.022 | +3.632 |
| Level | Intermediate | Major | Intermediate | - | Intermediate | Minor | Major |
To determine price objectives, it is also possible to use the pivot points. Here is the price position in relation to pivot points:
| Pivot points | S3 | S2 | S1 | PP | R1 | R2 | R3 |
|---|---|---|---|---|---|---|---|
| Standard | 2.936 | 2.978 | 3.016 | 3.058 | 3.096 | 3.138 | 3.176 |
| Camarilla | 3.032 | 3.039 | 3.047 | 3.054 | 3.061 | 3.069 | 3.076 |
| Woodie | 2.934 | 2.977 | 3.014 | 3.057 | 3.094 | 3.137 | 3.174 |
| Fibonacci | 2.978 | 3.009 | 3.027 | 3.058 | 3.089 | 3.107 | 3.138 |
| Pivot points | S3 | S2 | S1 | PP | R1 | R2 | R3 |
|---|---|---|---|---|---|---|---|
| Standard | 2.409 | 2.501 | 2.619 | 2.711 | 2.829 | 2.921 | 3.039 |
| Camarilla | 2.678 | 2.698 | 2.717 | 2.736 | 2.755 | 2.775 | 2.794 |
| Woodie | 2.421 | 2.508 | 2.631 | 2.718 | 2.841 | 2.928 | 3.051 |
| Fibonacci | 2.501 | 2.582 | 2.631 | 2.711 | 2.792 | 2.841 | 2.921 |
| Pivot points | S3 | S2 | S1 | PP | R1 | R2 | R3 |
|---|---|---|---|---|---|---|---|
| Standard | 1.747 | 1.941 | 2.263 | 2.457 | 2.779 | 2.973 | 3.295 |
| Camarilla | 2.442 | 2.489 | 2.537 | 2.584 | 2.631 | 2.679 | 2.726 |
| Woodie | 1.810 | 1.973 | 2.326 | 2.489 | 2.842 | 3.005 | 3.358 |
| Fibonacci | 1.941 | 2.138 | 2.260 | 2.457 | 2.654 | 2.776 | 2.973 |
Numerical data
The following are the details of the technical indicators and moving averages that were collected to generate this technical analysis:
| RSI (14): | 89.90 | |
| MACD (12,26,9): | 0.2270 | |
| Directional Movement: | 58.543 | |
| AROON (14): | 100.000 | |
| DEMA (21): | 3.024 | |
| Parabolic SAR (0,02-0,02-0,2): | 2.727 | |
| Elder Ray (13): | 0.736 | |
| Super Trend (3,10): | 3.067 | |
| Zig ZAG (10): | 3.930 | |
| VORTEX (21): | 1.2800 | |
| Stochastique (14,3,5): | 96.29 | |
| TEMA (21): | 3.215 | |
| Williams %R (14): | -2.88 | |
| Chande Momentum Oscillator (20): | 1.398 | |
| Repulse (5,40,3): | 24.6590 | |
| ROCnROLL: | 1 | |
| TRIX (15,9): | 0.6530 | |
| Courbe Coppock: | 54.54 |
| MA7: | 2.999 | |
| MA20: | 2.663 | |
| MA50: | 2.489 | |
| MA100: | 2.562 | |
| MAexp7: | 3.133 | |
| MAexp20: | 2.780 | |
| MAexp50: | 2.592 | |
| MAexp100: | 2.517 | |
| Price / MA7: | +31.98% | |
| Price / MA20: | +48.63% | |
| Price / MA50: | +59.02% | |
| Price / MA100: | +54.49% | |
| Price / MAexp7: | +26.33% | |
| Price / MAexp20: | +42.37% | |
| Price / MAexp50: | +52.70% | |
| Price / MAexp100: | +57.25% |
News
The latest news and videos published on ELIOR GROUP at the time of the analysis were as follows:
- Elior: Outstanding Shares and Voting Rights – Monthly Statement
- Elior Group: Solid Third-Quarter Organic Growth; Revision of the Adjusted EBITA Margin Outlook
- ELIOR GROUP: Half-year Statement of the Liquidity Contract
- ELIOR Group: Outstanding Shares and Voting Rights – Monthly Statement
- Elior Group: Outstanding Shares and Voting Rights – Monthly Statement
About author
Online


Add a comment
Comments
0 comments on the analysis ELIOR GROUP - Daily