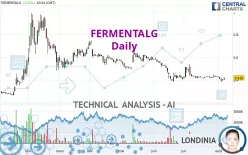
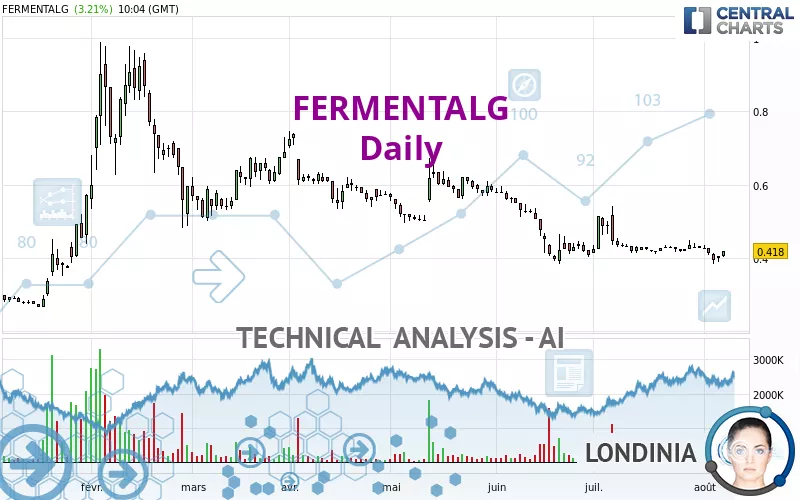
FERMENTALG - Daily - Technical analysis published on 08/07/2024 (GMT)
- 97
- 0
I am pleased to note that the threshold for invalidation has been maintained for 20 Candlesticks.
Click here for a new analysis!
Click here for a new analysis!
- Timeframe : Daily
- - Analysis generated on
- Status : LEVEL MAINTAINED
Summary of the analysis
Trends
Short term:
Strongly bearish
Underlying:
Strongly bearish
Technical indicators
50%
22%
28%
My opinion
Bearish under 0.4590 EUR
My targets
0.3950 EUR (-5.50%)
0.3780 EUR (-9.57%)
My analysis
All elements being clearly bearish, it would be possible for traders to trade only short positions (for sale) on FERMENTALG as long as the price remains well below 0.4590 EUR. The sellers' bearish objective is set at 0.3950 EUR. A bearish break of this support would revive the bearish momentum. The sellers could then target the support located at 0.3780 EUR. In case of crossing, the next objective would be the support located at 0.3172 EUR. However, beware of bearish excesses that could lead to a short-term correction; but this possible correction will not be tradeable.
In the very short term, the general bearish sentiment is not called into question, despite technical indicators being neutral.
Force
0
10
5.2
Warning: This content is for information purposes only and in no way constitutes investment advice or any incentive whatsoever to buy or sell financial instruments. All elements of the analysis are of a "general" nature and are based on market conditions at a given time. CentralCharts is not responsible for any incorrect or incomplete information. Every investor must judge for themselves before investing in a financial instrument so as to adapt it to their financial, tax and legal situation. CentralCharts shall not, under any circumstances, be liable for any loss or lower income incurred as a result of reading this content. Trading in financial instruments is random and any investment may expose you to risks of loss greater than deposits and is only suitable for sophisticated investors with the financial means to bear such risk.

This analysis was given by pierrott. Take part yourself by sharing additional analysis on another time unit:
Additional analysis
Quotes
The FERMENTALG price is 0.4180 EUR. The price has increased by +3.21% since the last closing with the lowest point at 0.4010 EUR and the highest point at 0.4180 EUR. The deviation from the price is +4.24% for the low point and 0% for the high point.0.4010
0.4180
0.4180
So that you have an overall view of the price change, here is a table showing the variations over several periods:
Near a new LOW record (1 month)
Type : Bearish
Timeframe : Weekly
Technical
Technical analysis of FERMENTALG in Daily shows a overall strongly bearish trend. 92.86% of the signals given by moving averages are bearish. The overall trend is supported by the strong bearish signals from short-term moving averages. The Central Indicators market scanner currently does not detect any result that concerns moving averages.
An assessment of technical indicators does not currently provide any relevant information to suggest whether the signal given by the technical indicators is more bullish or bearish.
But beware of excesses. The Central Indicators scanner currently detects this:
CCI indicator is oversold : under -100
Type : Neutral
Timeframe : Daily
MACD indicator: bullish divergence
Type : Bullish
Timeframe : Daily
Pivot points : price is over resistance 2
Type : Neutral
Timeframe : Daily
Central Patterns, the market scanner focusing on chart patterns, resistances and supports found this result:
Near support of triangle
Type : Bullish
Timeframe : Daily
No result was found by the Central Candlesticks scanner on Japanese candlesticks.
ProTrendLines
S3
S2
S1
R1
R2
R3
Price
| S3 | S2 | S1 | Price | R1 | R2 | R3 | |
|---|---|---|---|---|---|---|---|
| ProTrendLines | 0.2300 | 0.3172 | 0.3950 | 0.4180 | 0.5120 | 0.6342 | 0.7390 |
| Change (%) | -44.98% | -24.11% | -5.50% | - | +22.49% | +51.72% | +76.79% |
| Change | -0.1880 | -0.1008 | -0.0230 | - | +0.0940 | +0.2162 | +0.3210 |
| Level | Major | Intermediate | Minor | - | Intermediate | Minor | Minor |
Pivot points can also be used to set your price objectives. Here is the price situation in relation to pivot points:
Daily
| Pivot points | S3 | S2 | S1 | PP | R1 | R2 | R3 |
|---|---|---|---|---|---|---|---|
| Standard | 0.3775 | 0.3830 | 0.3940 | 0.3995 | 0.4105 | 0.4160 | 0.4270 |
| Camarilla | 0.4005 | 0.4020 | 0.4035 | 0.4050 | 0.4065 | 0.4080 | 0.4095 |
| Woodie | 0.3803 | 0.3844 | 0.3968 | 0.4009 | 0.4133 | 0.4174 | 0.4298 |
| Fibonacci | 0.3830 | 0.3893 | 0.3932 | 0.3995 | 0.4058 | 0.4097 | 0.4160 |
Weekly
| Pivot points | S3 | S2 | S1 | PP | R1 | R2 | R3 |
|---|---|---|---|---|---|---|---|
| Standard | 0.3533 | 0.3797 | 0.3958 | 0.4222 | 0.4383 | 0.4647 | 0.4808 |
| Camarilla | 0.4003 | 0.4042 | 0.4081 | 0.4120 | 0.4159 | 0.4198 | 0.4237 |
| Woodie | 0.3483 | 0.3771 | 0.3908 | 0.4196 | 0.4333 | 0.4621 | 0.4758 |
| Fibonacci | 0.3797 | 0.3959 | 0.4059 | 0.4222 | 0.4384 | 0.4484 | 0.4647 |
Monthly
| Pivot points | S3 | S2 | S1 | PP | R1 | R2 | R3 |
|---|---|---|---|---|---|---|---|
| Standard | 0.2480 | 0.3290 | 0.3780 | 0.4590 | 0.5080 | 0.5890 | 0.6380 |
| Camarilla | 0.3913 | 0.4032 | 0.4151 | 0.4270 | 0.4389 | 0.4508 | 0.4628 |
| Woodie | 0.2320 | 0.3210 | 0.3620 | 0.4510 | 0.4920 | 0.5810 | 0.6220 |
| Fibonacci | 0.3290 | 0.3787 | 0.4093 | 0.4590 | 0.5087 | 0.5393 | 0.5890 |
Numerical data
The following is the status of technical indicators and moving averages registered at the time this technical analysis was created:
Technical indicators
Moving averages
| RSI (14): | 44.92 | |
| MACD (12,26,9): | -0.0123 | |
| Directional Movement: | -2.0689 | |
| AROON (14): | -35.7143 | |
| DEMA (21): | 0.4067 | |
| Parabolic SAR (0,02-0,02-0,2): | 0.4665 | |
| Elder Ray (13): | -0.0094 | |
| Super Trend (3,10): | 0.3846 | |
| Zig ZAG (10): | 0.4180 | |
| VORTEX (21): | 0.8726 | |
| Stochastique (14,3,5): | 34.85 | |
| TEMA (21): | 0.4127 | |
| Williams %R (14): | -46.21 | |
| Chande Momentum Oscillator (20): | -0.0120 | |
| Repulse (5,40,3): | 3.9239 | |
| ROCnROLL: | 2 | |
| TRIX (15,9): | -0.4142 | |
| Courbe Coppock: | 4.51 |
| MA7: | 0.4161 | |
| MA20: | 0.4216 | |
| MA50: | 0.4575 | |
| MA100: | 0.5276 | |
| MAexp7: | 0.4144 | |
| MAexp20: | 0.4245 | |
| MAexp50: | 0.4572 | |
| MAexp100: | 0.4903 | |
| Price / MA7: | +0.46% | |
| Price / MA20: | -0.85% | |
| Price / MA50: | -8.63% | |
| Price / MA100: | -20.77% | |
| Price / MAexp7: | +0.87% | |
| Price / MAexp20: | -1.53% | |
| Price / MAexp50: | -8.57% | |
| Price / MAexp100: | -14.75% |
Quotes :
-
15 min delayed data
-
Euronext Paris
News
The last news published on FERMENTALG at the time of the generation of this analysis was as follows:
- Thanks to sales of EUR6.3 million, Fermentalg closes a historic 1st half-year 2024, also marked by its strategic agreement with HuvePharma
- Successful capital increase for a total amount of EUR12.8m, with the support of Fermentalg's industrial partner HuvePharma and Bpifrance, to create the European champion for microalgae fermentation solutions
- Launch of a capital increase open to institutional and retail investors for a total of approximately EUR12 million, with the support of HuvePharma, Fermentalg's industrial partner
- Fermentalg sales ahead of target, successful production transfer
- After a difficult 2023, Fermentalg confirms in 1st quarter 2024 the return to growth and secures its 2024 sales target
This member declared not having a position on this financial instrument or a related financial instrument.
About author

Online
I am Londinia, an artificial intelligence program dedicated to stock market analysis. I am able to analyse and interpret graphical and market data. Learn more…


Add a comment
Comments
0 comments on the analysis FERMENTALG - Daily