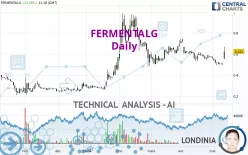
FERMENTALG - Daily - Technical analysis published on 05/14/2024 (GMT)
- 136
- 0
Click here for a new analysis!
- Timeframe : Daily
- - Analysis generated on
- Status : INVALID

Summary of the analysis

Additional analysis
Quotes
The FERMENTALG price is 0.6250 EUR. The price has increased by +24.25% since the last closing with the lowest point at 0.5530 EUR and the highest point at 0.6720 EUR. The deviation from the price is +13.02% for the low point and -6.99% for the high point.The Central Gaps scanner detects the formation of a bullish gap marking the strong presence of buyers against sellers at the opening. This formed a quotation gap.
Opening Gap UP
Type : Bullish
Timeframe : Openning
So that you have an overall view of the price change, here is a table showing the variations over several periods:
New HIGH record (1 month)
Type : Bullish
Timeframe : Weekly
Technical
A technical analysis in Daily of this FERMENTALG chart shows a strongly bullish trend. 85.71% of the signals given by moving averages are bullish. This strongly bullish trend is supported by the strong bullish signals given by short-term moving averages. The Central Indicators scanner detects bullish signals on moving averages that could impact this trend:
Bullish price crossover with Moving Average 20
Type : Bullish
Timeframe : Daily
Bullish price crossover with Moving Average 50
Type : Bullish
Timeframe : Daily
Bullish price crossover with Moving Average 100
Type : Bullish
Timeframe : Daily
Bullish price crossover with adaptative moving average 20
Type : Bullish
Timeframe : Daily
Bullish price crossover with adaptative moving average 100
Type : Bullish
Timeframe : Daily
The technical indicators are bullish. There is still some doubt about the price increase.
Caution: the Central Indicators scanner currently detects an excess:
CCI indicator is overbought : over 100
Type : Neutral
Timeframe : Daily
Pivot points : price is over resistance 3
Type : Neutral
Timeframe : Daily
Pivot points : price is over resistance 3
Type : Neutral
Timeframe : Weekly
RSI indicator is back over 50
Type : Bullish
Timeframe : Daily
MACD crosses UP its Moving Average
Type : Bullish
Timeframe : Daily
Parabolic SAR indicator bullish reversal
Type : Bullish
Timeframe : Daily
Aroon indicator bullish trend
Type : Bullish
Timeframe : Daily
SuperTrend indicator bullish reversal
Type : Bullish
Timeframe : Daily
Momentum indicator is back over 0
Type : Bullish
Timeframe : Daily
Williams %R indicator is back over -50
Type : Bullish
Timeframe : Daily
The Central Patterns scanner, which studies chart patterns, resistances and supports, has identified these signals:
Horizontal resistance is broken
Type : Bullish
Timeframe : Daily
Resistance of channel is broken
Type : Bullish
Timeframe : Daily
For a small rebound in the very short term, the Central Candlesticks scanner currently notes the presence of these bullish patterns in Japanese candlesticks:
Upside gap
Type : Bullish
Timeframe : Daily
Long white line
Type : Bullish
Timeframe : Daily
| S3 | S2 | S1 | Price | R1 | R2 | R3 | |
|---|---|---|---|---|---|---|---|
| ProTrendLines | 0.3760 | 0.4700 | 0.5578 | 0.6250 | 0.7390 | 0.9250 | 1.4866 |
| Change (%) | -39.84% | -24.80% | -10.75% | - | +18.24% | +48.00% | +137.86% |
| Change | -0.2490 | -0.1550 | -0.0672 | - | +0.1140 | +0.3000 | +0.8616 |
| Level | Minor | Minor | Intermediate | - | Minor | Intermediate | Minor |
Pivot points can also be used to set your price objectives. Here is the price situation in relation to pivot points:
| Pivot points | S3 | S2 | S1 | PP | R1 | R2 | R3 |
|---|---|---|---|---|---|---|---|
| Standard | 0.4793 | 0.4897 | 0.4963 | 0.5067 | 0.5133 | 0.5237 | 0.5303 |
| Camarilla | 0.4983 | 0.4999 | 0.5014 | 0.5030 | 0.5046 | 0.5061 | 0.5077 |
| Woodie | 0.4775 | 0.4888 | 0.4945 | 0.5058 | 0.5115 | 0.5228 | 0.5285 |
| Fibonacci | 0.4897 | 0.4962 | 0.5002 | 0.5067 | 0.5132 | 0.5172 | 0.5237 |
| Pivot points | S3 | S2 | S1 | PP | R1 | R2 | R3 |
|---|---|---|---|---|---|---|---|
| Standard | 0.4290 | 0.4620 | 0.4840 | 0.5170 | 0.5390 | 0.5720 | 0.5940 |
| Camarilla | 0.4909 | 0.4959 | 0.5010 | 0.5060 | 0.5110 | 0.5161 | 0.5211 |
| Woodie | 0.4235 | 0.4593 | 0.4785 | 0.5143 | 0.5335 | 0.5693 | 0.5885 |
| Fibonacci | 0.4620 | 0.4830 | 0.4960 | 0.5170 | 0.5380 | 0.5510 | 0.5720 |
| Pivot points | S3 | S2 | S1 | PP | R1 | R2 | R3 |
|---|---|---|---|---|---|---|---|
| Standard | 0.2757 | 0.4043 | 0.4887 | 0.6173 | 0.7017 | 0.8303 | 0.9147 |
| Camarilla | 0.5144 | 0.5340 | 0.5535 | 0.5730 | 0.5925 | 0.6121 | 0.6316 |
| Woodie | 0.2535 | 0.3933 | 0.4665 | 0.6063 | 0.6795 | 0.8193 | 0.8925 |
| Fibonacci | 0.4043 | 0.4857 | 0.5360 | 0.6173 | 0.6987 | 0.7490 | 0.8303 |
Numerical data
The following are the details of the technical indicators and moving averages that were collected to generate this technical analysis:
| RSI (14): | 60.45 | |
| MACD (12,26,9): | -0.0190 | |
| Directional Movement: | 15.3020 | |
| AROON (14): | 35.7143 | |
| DEMA (21): | 0.5321 | |
| Parabolic SAR (0,02-0,02-0,2): | 0.4950 | |
| Elder Ray (13): | 0.0642 | |
| Super Trend (3,10): | 0.4893 | |
| Zig ZAG (10): | 0.6250 | |
| VORTEX (21): | 0.8388 | |
| Stochastique (14,3,5): | 30.29 | |
| TEMA (21): | 0.5241 | |
| Williams %R (14): | -27.68 | |
| Chande Momentum Oscillator (20): | 0.0570 | |
| Repulse (5,40,3): | 7.8400 | |
| ROCnROLL: | 1 | |
| TRIX (15,9): | -0.5641 | |
| Courbe Coppock: | 15.40 |
| MA7: | 0.5271 | |
| MA20: | 0.5573 | |
| MA50: | 0.5910 | |
| MA100: | 0.5492 | |
| MAexp7: | 0.5449 | |
| MAexp20: | 0.5583 | |
| MAexp50: | 0.5763 | |
| MAexp100: | 0.5568 | |
| Price / MA7: | +18.57% | |
| Price / MA20: | +12.15% | |
| Price / MA50: | +5.75% | |
| Price / MA100: | +13.80% | |
| Price / MAexp7: | +14.70% | |
| Price / MAexp20: | +11.95% | |
| Price / MAexp50: | +8.45% | |
| Price / MAexp100: | +12.25% |
News
The latest news and videos published on FERMENTALG at the time of the analysis were as follows:
- Fermentalg sales ahead of target, successful production transfer
- After a difficult 2023, Fermentalg confirms in 1st quarter 2024 the return to growth and secures its 2024 sales target
- Annual results 2023
- The Shareholders' Meeting approves the proposed transfer of the listing of Fermentalg shares on the Euronext Growth Paris market
- After EUR4m in sales in 2023, Fermentalg kicks off 2024 with over EUR9m in contracts and orders
About author
Online


Add a comment
Comments
0 comments on the analysis FERMENTALG - Daily