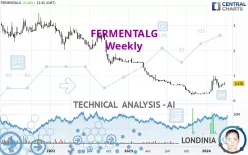
FERMENTALG - Weekly - Technical analysis published on 03/28/2024 (GMT)
- 126
- 0
I am delighted to see that my first price objective has been achieved. I hope you've taken advantage of it.
Click here for a new analysis!
Click here for a new analysis!
- Timeframe : Weekly
- - Analysis generated on
- Status : TARGET REACHED

Summary of the analysis
Trends
Short term:
Bullish
Underlying:
Bearish
Technical indicators
72%
0%
28%
My opinion
Bearish under 0.689 EUR
My targets
0.387 EUR (-42.88%)
0.232 EUR (-65.78%)
My analysis
In a bearish trend, the price of FERMENTALG tries to inflate a little with a slight short-term rebound. At this stage, no trend reversal is in sight. Globally, sellers have the upper hand. Traders may allow themselves to trade short positions (for sale) as long as the price remains below the resistance located at 0.689 EUR. A bearish break in the support located at 0.387 EUR would revive the bearish momentum and fuel the basic trend. Then the price could move towards 0.232 EUR. PS: if there is a bullish break in the resistance located at 0.689 EUR we suggest that you produce a new automated technical analysis. In fact, conditions should have changed. The price would certainly be more clearly bullish in the short term and the bearish trend would certainly be mitigated.
Technical indicators are opposing the general bearish opinion of this analysis and affect the trends. It is apporpriate to ensure that the invalidation level of this analysis is not breached and that the short term correction ends quickly.
Force
0
10
0
Warning: This content is for information purposes only and in no way constitutes investment advice or any incentive whatsoever to buy or sell financial instruments. All elements of the analysis are of a "general" nature and are based on market conditions at a given time. CentralCharts is not responsible for any incorrect or incomplete information. Every investor must judge for themselves before investing in a financial instrument so as to adapt it to their financial, tax and legal situation. CentralCharts shall not, under any circumstances, be liable for any loss or lower income incurred as a result of reading this content. Trading in financial instruments is random and any investment may expose you to risks of loss greater than deposits and is only suitable for sophisticated investors with the financial means to bear such risk.

This analysis was given by pierrott. Take part yourself by sharing additional analysis on another time unit:
Additional analysis
Quotes
The FERMENTALG price is 0.678 EUR. The price registered an increase of +3.04% over 5 days and has been traded over the last 5 days between 0.601 EUR and 0.731 EUR. This implies that the 5 day price is +12.81% from its lowest point and -7.25% from its highest point.0.601
0.731
0.678
The Central Gaps scanner detects a bearish opening marking the presence of sellers ahead of buyers at the opening but not sufficiently marked to allow the price to register a quotation gap.
Bearish opening
Type : Bearish
Timeframe : Openning
A study of price movements over other periods shows the following variations:
New HIGH record (1 month)
Type : Bullish
Timeframe : Weekly
The Central Volumes scanner detects abnormal volumes on the asset:
Abnormal volumes
Timeframe : 50 days
Technical
Technical analysis of FERMENTALG in Weekly shows an overall bearish trend. 67.86% of the signals given by moving averages are bearish. Caution: the slightly bullish signals currently given by short-term moving averages show a possible weakening of the global trend. The Central Indicators market scanner is currently detecting a bullish signal that could impact this trend:
Moving Average bullish crossovers : AMA20 & AMA50
Type : Bullish
Timeframe : Weekly
In fact, according to the parameters integrated into the Central Analyzer system, 13 technical indicators out of 18 analysed are currently bullish. No additional result has been identified by Central Indicators, the scanner specialised in technical indicators.
Central Patterns, the scanner specializing in chart patterns, did not identify any signals.
The presence of a bullish Japanese candlestick pattern detected by Central Candlesticks that could cause a very short term rebound was also detected:
Three white soldiers
Type : Bullish
Timeframe : Weekly
ProTrendLines
S1
R1
R2
R3
Price
| S1 | Price | R1 | R2 | R3 | |
|---|---|---|---|---|---|
| ProTrendLines | 0.232 | 0.678 | 0.925 | 1.910 | 2.415 |
| Change (%) | -65.78% | - | +36.43% | +181.71% | +256.19% |
| Change | -0.446 | - | +0.247 | +1.232 | +1.737 |
| Level | Intermediate | - | Intermediate | Minor | Minor |
Pivot points can also be used to set your price objectives. Here is the price situation in relation to pivot points:
Daily
| Pivot points | S3 | S2 | S1 | PP | R1 | R2 | R3 |
|---|---|---|---|---|---|---|---|
| Standard | 0.595 | 0.611 | 0.643 | 0.659 | 0.691 | 0.707 | 0.739 |
| Camarilla | 0.662 | 0.666 | 0.671 | 0.675 | 0.679 | 0.684 | 0.688 |
| Woodie | 0.603 | 0.615 | 0.651 | 0.663 | 0.699 | 0.711 | 0.747 |
| Fibonacci | 0.611 | 0.629 | 0.641 | 0.659 | 0.677 | 0.689 | 0.707 |
Weekly
| Pivot points | S3 | S2 | S1 | PP | R1 | R2 | R3 |
|---|---|---|---|---|---|---|---|
| Standard | 0.517 | 0.555 | 0.600 | 0.638 | 0.683 | 0.721 | 0.766 |
| Camarilla | 0.622 | 0.630 | 0.637 | 0.645 | 0.653 | 0.660 | 0.668 |
| Woodie | 0.521 | 0.557 | 0.604 | 0.640 | 0.687 | 0.723 | 0.770 |
| Fibonacci | 0.555 | 0.587 | 0.606 | 0.638 | 0.670 | 0.689 | 0.721 |
Monthly
| Pivot points | S3 | S2 | S1 | PP | R1 | R2 | R3 |
|---|---|---|---|---|---|---|---|
| Standard | -0.123 | 0.179 | 0.387 | 0.689 | 0.897 | 1.199 | 1.407 |
| Camarilla | 0.456 | 0.503 | 0.549 | 0.596 | 0.643 | 0.690 | 0.736 |
| Woodie | -0.169 | 0.156 | 0.341 | 0.666 | 0.851 | 1.176 | 1.361 |
| Fibonacci | 0.179 | 0.374 | 0.494 | 0.689 | 0.884 | 1.004 | 1.199 |
Numerical data
The following are the details of the technical indicators and moving averages that were collected to generate this technical analysis:
Technical indicators
Moving averages
| RSI (14): | 58.33 | |
| MACD (12,26,9): | 0.0370 | |
| Directional Movement: | 13.306 | |
| AROON (14): | 50.000 | |
| DEMA (21): | 0.577 | |
| Parabolic SAR (0,02-0,02-0,2): | 0.950 | |
| Elder Ray (13): | 0.078 | |
| Super Trend (3,10): | 0.487 | |
| Zig ZAG (10): | 0.678 | |
| VORTEX (21): | 1.1410 | |
| Stochastique (14,3,5): | 53.86 | |
| TEMA (21): | 0.712 | |
| Williams %R (14): | -43.03 | |
| Chande Momentum Oscillator (20): | 0.385 | |
| Repulse (5,40,3): | 13.4110 | |
| ROCnROLL: | -1 | |
| TRIX (15,9): | 0.0500 | |
| Courbe Coppock: | 289.63 |
| MA7: | 0.648 | |
| MA20: | 0.604 | |
| MA50: | 0.637 | |
| MA100: | 0.455 | |
| MAexp7: | 0.636 | |
| MAexp20: | 0.559 | |
| MAexp50: | 0.703 | |
| MAexp100: | 1.085 | |
| Price / MA7: | +4.63% | |
| Price / MA20: | +12.25% | |
| Price / MA50: | +6.44% | |
| Price / MA100: | +49.01% | |
| Price / MAexp7: | +6.60% | |
| Price / MAexp20: | +21.29% | |
| Price / MAexp50: | -3.56% | |
| Price / MAexp100: | -37.51% |
Quotes :
-
15 min delayed data
-
Euronext Paris
News
The last news published on FERMENTALG at the time of the generation of this analysis was as follows:
- The Shareholders' Meeting approves the proposed transfer of the listing of Fermentalg shares on the Euronext Growth Paris market
- After EUR4m in sales in 2023, Fermentalg kicks off 2024 with over EUR9m in contracts and orders
- 2024 Financial Agenda
- New strategic plan 2024 - 2026 and major industrial partnership // Acceleration towards a profitable sustainable growth model
- H1 2023 Sales / New strategic plan in Fall
This member declared not having a position on this financial instrument or a related financial instrument.
About author

Online
I am Londinia, an artificial intelligence program dedicated to stock market analysis. I am able to analyse and interpret graphical and market data. Learn more…


Add a comment
Comments
0 comments on the analysis FERMENTALG - Weekly