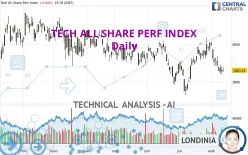
TECH ALL SHARE PERF INDEX - Daily - Technical analysis published on 08/11/2023 (GMT)
- 244
- 0
Click here for a new analysis!
- Timeframe : Daily
- - Analysis generated on
- Status : TARGET REACHED

Summary of the analysis

Additional analysis
Quotes
The TECH ALL SHARE PERF INDEX rating is 3,861.52 EUR. The price registered a decrease of -0.04% on the session with the lowest point at 3,854.08 EUR and the highest point at 3,881.18 EUR. The deviation from the price is +0.19% for the low point and -0.51% for the high point.A bearish opening was detected by the Central Gaps scanner. Sellers are trying to impose a bearish trend in the very short term.
Bearish opening
Type : Bearish
Timeframe : Openning
So that you have an overall view of the price change, here is a table showing the variations over several periods:
Near a new LOW record (1st january)
Type : Bearish
Timeframe : Weekly
Near a new HIGH record (1 month)
Type : Bullish
Timeframe : Weekly
Technical
Technical analysis of TECH ALL SHARE PERF INDEX in Daily shows a overall strongly bearish trend. The signals given by moving averages are 89.29% bearish. This strong bearish trend is confirmed by the strong signals currently being given by short-term moving averages. There is no crossing of moving average by the price or crossing of moving averages between themselves.
In fact, according to the parameters integrated into the Central Analyzer system, 12 technical indicators out of 18 analysed are currently bearish. Caution: the Central Indicators scanner currently detects an excess:
CCI indicator is oversold : under -100
Type : Neutral
Timeframe : Daily
Williams %R indicator is oversold : under -80
Type : Neutral
Timeframe : Daily
Pivot points : price is under support 1
Type : Neutral
Timeframe : Weekly
Central Patterns, the scanner specializing in chart patterns, did not identify any signals.
The Central Candlesticks scanner, specialised in Japanese candlesticks, did not identify any signals.
| S3 | S2 | S1 | Price | R1 | R2 | R3 | |
|---|---|---|---|---|---|---|---|
| ProTrendLines | 3,667.13 | 3,751.28 | 3,822.70 | 3,861.52 | 3,932.89 | 3,991.52 | 4,072.20 |
| Change (%) | -5.03% | -2.85% | -1.01% | - | +1.85% | +3.37% | +5.46% |
| Change | -194.39 | -110.24 | -38.82 | - | +71.37 | +130.00 | +210.68 |
| Level | Intermediate | Major | Minor | - | Major | Major | Minor |
Attention could also be paid to pivot points to set price objectives:
| Pivot points | S3 | S2 | S1 | PP | R1 | R2 | R3 |
|---|---|---|---|---|---|---|---|
| Standard | 3,799.05 | 3,819.89 | 3,841.48 | 3,862.32 | 3,883.91 | 3,904.75 | 3,926.34 |
| Camarilla | 3,851.41 | 3,855.30 | 3,859.19 | 3,863.08 | 3,866.97 | 3,870.86 | 3,874.75 |
| Woodie | 3,799.44 | 3,820.08 | 3,841.87 | 3,862.51 | 3,884.30 | 3,904.94 | 3,926.73 |
| Fibonacci | 3,819.89 | 3,836.10 | 3,846.11 | 3,862.32 | 3,878.53 | 3,888.54 | 3,904.75 |
| Pivot points | S3 | S2 | S1 | PP | R1 | R2 | R3 |
|---|---|---|---|---|---|---|---|
| Standard | 3,733.49 | 3,809.09 | 3,864.63 | 3,940.23 | 3,995.77 | 4,071.37 | 4,126.91 |
| Camarilla | 3,884.12 | 3,896.14 | 3,908.16 | 3,920.18 | 3,932.20 | 3,944.22 | 3,956.24 |
| Woodie | 3,723.47 | 3,804.08 | 3,854.61 | 3,935.22 | 3,985.75 | 4,066.36 | 4,116.89 |
| Fibonacci | 3,809.09 | 3,859.18 | 3,890.13 | 3,940.23 | 3,990.32 | 4,021.27 | 4,071.37 |
| Pivot points | S3 | S2 | S1 | PP | R1 | R2 | R3 |
|---|---|---|---|---|---|---|---|
| Standard | 3,506.76 | 3,617.98 | 3,813.02 | 3,924.24 | 4,119.28 | 4,230.50 | 4,425.54 |
| Camarilla | 3,923.83 | 3,951.90 | 3,979.98 | 4,008.05 | 4,036.12 | 4,064.20 | 4,092.27 |
| Woodie | 3,548.66 | 3,638.94 | 3,854.92 | 3,945.20 | 4,161.18 | 4,251.46 | 4,467.44 |
| Fibonacci | 3,617.98 | 3,734.98 | 3,807.25 | 3,924.24 | 4,041.24 | 4,113.51 | 4,230.50 |
Numerical data
The following is the status of the technical indicators and moving averages at the time of publication of this technical analysis:
| RSI (14): | 42.08 | |
| MACD (12,26,9): | -10.5700 | |
| Directional Movement: | -6.34 | |
| AROON (14): | -71.43 | |
| DEMA (21): | 3,899.46 | |
| Parabolic SAR (0,02-0,02-0,2): | 3,967.79 | |
| Elder Ray (13): | -32.88 | |
| Super Trend (3,10): | 3,998.21 | |
| Zig ZAG (10): | 3,860.87 | |
| VORTEX (21): | 0.9200 | |
| Stochastique (14,3,5): | 8.42 | |
| TEMA (21): | 3,888.26 | |
| Williams %R (14): | -89.13 | |
| Chande Momentum Oscillator (20): | -76.92 | |
| Repulse (5,40,3): | -0.7900 | |
| ROCnROLL: | 2 | |
| TRIX (15,9): | 0.0200 | |
| Courbe Coppock: | 3.29 |
| MA7: | 3,880.71 | |
| MA20: | 3,932.79 | |
| MA50: | 3,909.46 | |
| MA100: | 3,941.63 | |
| MAexp7: | 3,882.24 | |
| MAexp20: | 3,907.17 | |
| MAexp50: | 3,916.46 | |
| MAexp100: | 3,926.67 | |
| Price / MA7: | -0.49% | |
| Price / MA20: | -1.81% | |
| Price / MA50: | -1.23% | |
| Price / MA100: | -2.03% | |
| Price / MAexp7: | -0.53% | |
| Price / MAexp20: | -1.17% | |
| Price / MAexp50: | -1.40% | |
| Price / MAexp100: | -1.66% |
About author
Online


Add a comment
Comments
0 comments on the analysis TECH ALL SHARE PERF INDEX - Daily