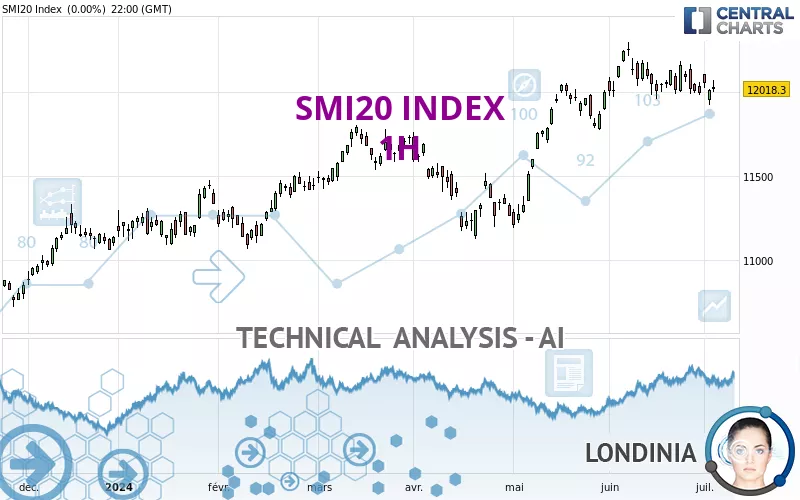
SMI20 INDEX - 1H - Technical analysis published on 07/04/2024 (GMT)
- 207
- 0
Click here for a new analysis!
- Timeframe : 1H
- - Analysis generated on
- Status : INVALID

Summary of the analysis

Additional analysis
Quotes
SMI20 INDEX rating 12,007.78 EUR. The price is lower by -0.09% since the last closing with the lowest point at 11,988.30 EUR and the highest point at 12,026.83 EUR. The deviation from the price is +0.16% for the low point and -0.16% for the high point.A bearish gap was detected at the opening by the Central Gaps scanner. There are a lot of sellers and they have the upper hand in the very short term.
Opening Gap DOWN
Type : Bearish
Timeframe : Openning
So that you have an overall view of the price change, here is a table showing the variations over several periods:
Near a new HIGH record (1 year)
Type : Bullish
Timeframe : Weekly
Near a new HIGH record (1st january)
Type : Bullish
Timeframe : Weekly
Near a new HIGH record (1 month)
Type : Bullish
Timeframe : Weekly
Technical
Technical analysis of this 1H chart of SMI20 INDEX indicates that the overall trend is strongly bearish. 85.71% of the signals given by moving averages are bearish. The slightly bearish signals from short-term moving averages show that the overall trend is slowing down. The Central Indicators market scanner is currently detecting several bearish signals that could impact this trend:
Bearish trend reversal : Moving Average 100
Type : Bearish
Timeframe : 1 hour
Bearish trend reversal : adaptative moving average 50
Type : Bearish
Timeframe : 1 hour
Bearish price crossover with Moving Average 50
Type : Bearish
Timeframe : 1 hour
An assessment of technical indicators shows a slightly bullish signal.
Central Indicators, the scanner specialised in technical indicators, has identified these signals:
RSI indicator is back under 50
Type : Bearish
Timeframe : 1 hour
Price is back under the pivot point
Type : Bearish
Timeframe : Weekly
No signals are given by Central Patterns, a market scanner specialised in chart patterns, resistances and supports.
The Central Candlesticks scanner which studies Japanese candlesticks did not detect anything.
| S3 | S2 | S1 | Price | R1 | R2 | R3 | |
|---|---|---|---|---|---|---|---|
| ProTrendLines | 11,920.09 | 11,955.08 | 11,986.26 | 12,007.78 | 12,067.84 | 12,129.14 | 12,159.69 |
| Change (%) | -0.73% | -0.44% | -0.18% | - | +0.50% | +1.01% | +1.27% |
| Change | -87.69 | -52.70 | -21.52 | - | +60.06 | +121.36 | +151.91 |
| Level | Minor | Minor | Intermediate | - | Intermediate | Minor | Major |
To determine price objectives, it is also possible to use the pivot points. Here is the price position in relation to pivot points:
| Pivot points | S3 | S2 | S1 | PP | R1 | R2 | R3 |
|---|---|---|---|---|---|---|---|
| Standard | 11,915.96 | 11,955.98 | 11,987.14 | 12,027.16 | 12,058.32 | 12,098.34 | 12,129.50 |
| Camarilla | 11,998.73 | 12,005.25 | 12,011.78 | 12,018.30 | 12,024.83 | 12,031.35 | 12,037.88 |
| Woodie | 11,911.53 | 11,953.77 | 11,982.71 | 12,024.95 | 12,053.89 | 12,096.13 | 12,125.07 |
| Fibonacci | 11,955.98 | 11,983.17 | 11,999.97 | 12,027.16 | 12,054.35 | 12,071.15 | 12,098.34 |
| Pivot points | S3 | S2 | S1 | PP | R1 | R2 | R3 |
|---|---|---|---|---|---|---|---|
| Standard | 11,722.13 | 11,851.16 | 11,922.50 | 12,051.53 | 12,122.87 | 12,251.90 | 12,323.24 |
| Camarilla | 11,938.73 | 11,957.10 | 11,975.46 | 11,993.83 | 12,012.20 | 12,030.57 | 12,048.93 |
| Woodie | 11,693.28 | 11,836.74 | 11,893.65 | 12,037.11 | 12,094.02 | 12,237.48 | 12,294.39 |
| Fibonacci | 11,851.16 | 11,927.71 | 11,974.99 | 12,051.53 | 12,128.08 | 12,175.36 | 12,251.90 |
| Pivot points | S3 | S2 | S1 | PP | R1 | R2 | R3 |
|---|---|---|---|---|---|---|---|
| Standard | 11,527.45 | 11,741.26 | 11,867.55 | 12,081.36 | 12,207.65 | 12,421.46 | 12,547.75 |
| Camarilla | 11,900.30 | 11,931.48 | 11,962.65 | 11,993.83 | 12,025.01 | 12,056.18 | 12,087.36 |
| Woodie | 11,483.68 | 11,719.38 | 11,823.78 | 12,059.48 | 12,163.88 | 12,399.58 | 12,503.98 |
| Fibonacci | 11,741.26 | 11,871.18 | 11,951.45 | 12,081.36 | 12,211.28 | 12,291.55 | 12,421.46 |
Numerical data
The following are the details of the technical indicators and moving averages that were collected to generate this technical analysis:
| RSI (14): | 48.30 | |
| MACD (12,26,9): | 2.3200 | |
| Directional Movement: | -2.49 | |
| AROON (14): | 64.29 | |
| DEMA (21): | 12,017.94 | |
| Parabolic SAR (0,02-0,02-0,2): | 11,965.34 | |
| Elder Ray (13): | -11.71 | |
| Super Trend (3,10): | 11,960.72 | |
| Zig ZAG (10): | 12,011.20 | |
| VORTEX (21): | 1.0200 | |
| Stochastique (14,3,5): | 64.51 | |
| TEMA (21): | 12,026.82 | |
| Williams %R (14): | -41.56 | |
| Chande Momentum Oscillator (20): | 31.80 | |
| Repulse (5,40,3): | 0.0100 | |
| ROCnROLL: | 2 | |
| TRIX (15,9): | 0.0000 | |
| Courbe Coppock: | 0.97 |
| MA7: | 12,014.63 | |
| MA20: | 12,068.70 | |
| MA50: | 11,865.47 | |
| MA100: | 11,676.48 | |
| MAexp7: | 12,022.19 | |
| MAexp20: | 12,017.38 | |
| MAexp50: | 12,024.48 | |
| MAexp100: | 12,034.73 | |
| Price / MA7: | -0.06% | |
| Price / MA20: | -0.50% | |
| Price / MA50: | +1.20% | |
| Price / MA100: | +2.84% | |
| Price / MAexp7: | -0.12% | |
| Price / MAexp20: | -0.08% | |
| Price / MAexp50: | -0.14% | |
| Price / MAexp100: | -0.22% |
About author
Online


Add a comment
Comments
0 comments on the analysis SMI20 INDEX - 1H