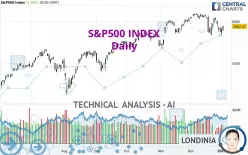
S&P500 INDEX - Daily - Technical analysis published on 01/06/2025 (GMT)
- 179
- 0
Click here for a new analysis!
- Timeframe : Daily
- - Analysis generated on
- Status : INVALID

Summary of the analysis

Additional analysis
Quotes
The S&P500 INDEX price is 5,942.47 USD. The price has increased by +1.26% since the last closing and was between 5,888.66 USD and 5,949.34 USD. This implies that the price is at +0.91% from its lowest and at -0.12% from its highest.The Central Gaps scanner detects a bullish opening. A small advantage for buyers in the very short term.
Bullish opening
Type : Bullish
Timeframe : Openning
Here is a more detailed summary of the historical variations registered by S&P500 INDEX:
Near a new HIGH record (5 years)
Type : Bullish
Timeframe : Weekly
Near a new HIGH record (1 year)
Type : Bullish
Timeframe : Weekly
New HIGH record (1st january)
Type : Bullish
Timeframe : Weekly
Near a new HIGH record (1 month)
Type : Bullish
Timeframe : Weekly
Technical
Technical analysis of S&P500 INDEX in Daily shows an overall bullish trend. The signals given by moving averages are 67.86% bullish. This bullish trend could slow down given the slightly bearish signals currently being given by short-term moving averages. An assessment of moving averages reveals a bullish signal that could impact this trend:
Bullish price crossover with adaptative moving average 50
Type : Bullish
Timeframe : Daily
An assessment of technical indicators does not currently provide any relevant information on the direction of future price movements.
Caution: the Central Indicators scanner currently detects an excess:
RSI indicator: bullish divergence
Type : Bullish
Timeframe : Daily
Pivot points : price is over resistance 1
Type : Neutral
Timeframe : Daily
Ichimoku : price is over the cloud
Type : Bullish
Timeframe : Daily
No signals are given by Central Patterns, a market scanner specialised in chart patterns, resistances and supports.
The Central Candlesticks scanner, specialised in Japanese candlesticks, did not identify any signals.
| S3 | S2 | S1 | Price | R1 | R2 | |
|---|---|---|---|---|---|---|
| ProTrendLines | 5,406.58 | 5,667.20 | 5,866.43 | 5,942.47 | 6,001.35 | 6,090.27 |
| Change (%) | -9.02% | -4.63% | -1.28% | - | +0.99% | +2.49% |
| Change | -535.89 | -275.27 | -76.04 | - | +58.88 | +147.80 |
| Level | Minor | Intermediate | Major | - | Intermediate | Major |
Pivot points can also be used to set your price objectives. Here is the price situation in relation to pivot points:
| Pivot points | S3 | S2 | S1 | PP | R1 | R2 | R3 |
|---|---|---|---|---|---|---|---|
| Standard | 5,843.63 | 5,866.14 | 5,904.31 | 5,926.82 | 5,964.99 | 5,987.50 | 6,025.67 |
| Camarilla | 5,925.78 | 5,931.35 | 5,936.91 | 5,942.47 | 5,948.03 | 5,953.60 | 5,959.16 |
| Woodie | 5,851.45 | 5,870.06 | 5,912.13 | 5,930.74 | 5,972.81 | 5,991.42 | 6,033.49 |
| Fibonacci | 5,866.14 | 5,889.32 | 5,903.64 | 5,926.82 | 5,950.00 | 5,964.32 | 5,987.50 |
| Pivot points | S3 | S2 | S1 | PP | R1 | R2 | R3 |
|---|---|---|---|---|---|---|---|
| Standard | 5,745.08 | 5,787.30 | 5,864.89 | 5,907.11 | 5,984.70 | 6,026.92 | 6,104.51 |
| Camarilla | 5,909.52 | 5,920.51 | 5,931.49 | 5,942.47 | 5,953.45 | 5,964.44 | 5,975.42 |
| Woodie | 5,762.76 | 5,796.14 | 5,882.57 | 5,915.95 | 6,002.38 | 6,035.76 | 6,122.19 |
| Fibonacci | 5,787.30 | 5,833.07 | 5,861.35 | 5,907.11 | 5,952.88 | 5,981.16 | 6,026.92 |
| Pivot points | S3 | S2 | S1 | PP | R1 | R2 | R3 |
|---|---|---|---|---|---|---|---|
| Standard | 5,508.29 | 5,670.30 | 5,775.96 | 5,937.97 | 6,043.63 | 6,205.64 | 6,311.30 |
| Camarilla | 5,808.02 | 5,832.56 | 5,857.09 | 5,881.63 | 5,906.17 | 5,930.70 | 5,955.24 |
| Woodie | 5,480.13 | 5,656.21 | 5,747.80 | 5,923.88 | 6,015.47 | 6,191.55 | 6,283.14 |
| Fibonacci | 5,670.30 | 5,772.55 | 5,835.72 | 5,937.97 | 6,040.22 | 6,103.39 | 6,205.64 |
Numerical data
The following is the status of the technical indicators and moving averages at the time of publication of this technical analysis:
| RSI (14): | 47.98 | |
| MACD (12,26,9): | -13.8900 | |
| Directional Movement: | -13.09 | |
| AROON (14): | -78.57 | |
| DEMA (21): | 5,956.16 | |
| Parabolic SAR (0,02-0,02-0,2): | 6,045.35 | |
| Elder Ray (13): | -33.96 | |
| Super Trend (3,10): | 6,075.76 | |
| Zig ZAG (10): | 5,942.47 | |
| VORTEX (21): | 0.7900 | |
| Stochastique (14,3,5): | 26.13 | |
| TEMA (21): | 5,913.76 | |
| Williams %R (14): | -55.82 | |
| Chande Momentum Oscillator (20): | -131.61 | |
| Repulse (5,40,3): | 0.3300 | |
| ROCnROLL: | -1 | |
| TRIX (15,9): | 0.0100 | |
| Courbe Coppock: | 4.16 |
| MA7: | 5,949.72 | |
| MA20: | 5,992.83 | |
| MA50: | 5,944.59 | |
| MA100: | 5,803.81 | |
| MAexp7: | 5,931.76 | |
| MAexp20: | 5,963.86 | |
| MAexp50: | 5,927.26 | |
| MAexp100: | 5,808.68 | |
| Price / MA7: | -0.12% | |
| Price / MA20: | -0.84% | |
| Price / MA50: | -0.04% | |
| Price / MA100: | +2.39% | |
| Price / MAexp7: | +0.18% | |
| Price / MAexp20: | -0.36% | |
| Price / MAexp50: | +0.26% | |
| Price / MAexp100: | +2.30% |
News
The latest news and videos published on S&P500 INDEX at the time of the analysis were as follows:
-
 S&P 500 Daily Price Forecast and Technical Analysis for FX Empire (12/30) #spx #trading #SP500
-
S&P 500 Daily Price Forecast and Technical Analysis for FX Empire (12/23) #spx #trading #SP500
-
S&P 500 Daily Price Forecast and Technical Analysis for December 19, 2024 #spx #trading #SP500
-
S&P 500 Daily Price Forecast and Technical Analysis for December 11, 2024 #spx #trading #SP50
-
S&P 500 Daily Price Forecast and Technical Analysis for December 11, 2024 #spx #trading ##SP500
About author

Online


Add a comment
Comments
0 comments on the analysis S&P500 INDEX - Daily