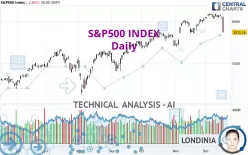
S&P500 INDEX - Daily - Technical analysis published on 12/19/2024 (GMT)
- 127
- 0
Click here for a new analysis!
- Timeframe : Daily
- - Analysis generated on
- Status : LEVEL MAINTAINED

Summary of the analysis

Additional analysis
Quotes
The S&P500 INDEX rating is 5,872.16 USD. On the day, this instrument lost -2.95% and was between 5,867.79 USD and 6,070.67 USD. This implies that the price is at +0.07% from its lowest and at -3.27% from its highest.A study of price movements over other periods shows the following variations:
Near a new HIGH record (5 years)
Type : Bullish
Timeframe : Weekly
Near a new HIGH record (1 year)
Type : Bullish
Timeframe : Weekly
Near a new HIGH record (1st january)
Type : Bullish
Timeframe : Weekly
Near a new HIGH record (1 month)
Type : Bullish
Timeframe : Weekly
Technical
A technical analysis in Daily of this S&P500 INDEX chart shows a slightly bullish trend. 57.14% of the signals given by moving averages are bullish. Caution: the strong bearish signals currently being given by short-term moving averages indicate that this slightly bullish trend could be reversed. The Central Indicators scanner detects bearish signals on moving averages that could impact this trend:
Bearish price crossover with Moving Average 20
Type : Bearish
Timeframe : Daily
Bearish price crossover with Moving Average 50
Type : Bearish
Timeframe : Daily
Bearish price crossover with adaptative moving average 20
Type : Bearish
Timeframe : Daily
Bearish price crossover with adaptative moving average 50
Type : Bearish
Timeframe : Daily
In fact, according to the parameters integrated into the Central Analyzer system, only 7 technical indicators out of 18 analysed are currently bearish. But beware of excesses. The Central Indicators scanner currently detects this:
CCI indicator is oversold : under -100
Type : Neutral
Timeframe : Daily
Williams %R indicator is oversold : under -80
Type : Neutral
Timeframe : Daily
Pivot points : price is under support 3
Type : Neutral
Timeframe : Daily
Pivot points : price is under support 3
Type : Neutral
Timeframe : Weekly
RSI indicator is back under 50
Type : Bearish
Timeframe : Daily
SuperTrend indicator bearish reversal
Type : Bearish
Timeframe : Daily
Momentum indicator is back under 0
Type : Bearish
Timeframe : Daily
The analysis of the price chart with Central Patterns scanners does not return any result.
The presence of a bearish pattern in Japanese candlesticks detected by Central Candlesticks that could cause a correction in the very short term was also detected:
Long black line
Type : Bearish
Timeframe : Daily
| S3 | S2 | S1 | Price | R1 | |
|---|---|---|---|---|---|
| ProTrendLines | 5,186.33 | 5,406.58 | 5,667.20 | 5,872.16 | 6,090.27 |
| Change (%) | -11.68% | -7.93% | -3.49% | - | +3.71% |
| Change | -685.83 | -465.58 | -204.96 | - | +218.11 |
| Level | Major | Minor | Major | - | Major |
To determine price objectives, it is also possible to use the pivot points. Here is the price position in relation to pivot points:
| Pivot points | S3 | S2 | S1 | PP | R1 | R2 | R3 |
|---|---|---|---|---|---|---|---|
| Standard | 5,600.20 | 5,733.99 | 5,803.08 | 5,936.87 | 6,005.96 | 6,139.75 | 6,208.84 |
| Camarilla | 5,816.37 | 5,834.97 | 5,853.56 | 5,872.16 | 5,890.76 | 5,909.36 | 5,927.95 |
| Woodie | 5,567.84 | 5,717.82 | 5,770.72 | 5,920.70 | 5,973.60 | 6,123.58 | 6,176.48 |
| Fibonacci | 5,733.99 | 5,811.49 | 5,859.37 | 5,936.87 | 6,014.37 | 6,062.25 | 6,139.75 |
| Pivot points | S3 | S2 | S1 | PP | R1 | R2 | R3 |
|---|---|---|---|---|---|---|---|
| Standard | 5,960.42 | 5,995.16 | 6,023.12 | 6,057.86 | 6,085.82 | 6,120.56 | 6,148.52 |
| Camarilla | 6,033.85 | 6,039.60 | 6,045.34 | 6,051.09 | 6,056.84 | 6,062.59 | 6,068.33 |
| Woodie | 5,957.04 | 5,993.47 | 6,019.74 | 6,056.17 | 6,082.44 | 6,118.87 | 6,145.14 |
| Fibonacci | 5,995.16 | 6,019.11 | 6,033.91 | 6,057.86 | 6,081.81 | 6,096.61 | 6,120.56 |
| Pivot points | S3 | S2 | S1 | PP | R1 | R2 | R3 |
|---|---|---|---|---|---|---|---|
| Standard | 5,456.88 | 5,576.69 | 5,804.54 | 5,924.35 | 6,152.20 | 6,272.01 | 6,499.86 |
| Camarilla | 5,936.77 | 5,968.64 | 6,000.51 | 6,032.38 | 6,064.25 | 6,096.12 | 6,127.99 |
| Woodie | 5,510.89 | 5,603.70 | 5,858.55 | 5,951.36 | 6,206.21 | 6,299.02 | 6,553.87 |
| Fibonacci | 5,576.69 | 5,709.50 | 5,791.55 | 5,924.35 | 6,057.16 | 6,139.21 | 6,272.01 |
Numerical data
The following are the details of the technical indicators and moving averages that were collected to generate this technical analysis:
| RSI (14): | 37.56 | |
| MACD (12,26,9): | 27.6200 | |
| Directional Movement: | -19.68 | |
| AROON (14): | -57.14 | |
| DEMA (21): | 6,055.91 | |
| Parabolic SAR (0,02-0,02-0,2): | 6,091.97 | |
| Elder Ray (13): | -51.52 | |
| Super Trend (3,10): | 6,140.48 | |
| Zig ZAG (10): | 5,872.16 | |
| VORTEX (21): | 0.9200 | |
| Stochastique (14,3,5): | 45.50 | |
| TEMA (21): | 6,034.43 | |
| Williams %R (14): | -98.12 | |
| Chande Momentum Oscillator (20): | -174.99 | |
| Repulse (5,40,3): | -4.3100 | |
| ROCnROLL: | 2 | |
| TRIX (15,9): | 0.1200 | |
| Courbe Coppock: | 1.21 |
| MA7: | 6,031.18 | |
| MA20: | 6,024.77 | |
| MA50: | 5,922.51 | |
| MA100: | 5,743.46 | |
| MAexp7: | 6,011.24 | |
| MAexp20: | 6,009.21 | |
| MAexp50: | 5,920.78 | |
| MAexp100: | 5,779.15 | |
| Price / MA7: | -2.64% | |
| Price / MA20: | -2.53% | |
| Price / MA50: | -0.85% | |
| Price / MA100: | +2.24% | |
| Price / MAexp7: | -2.31% | |
| Price / MAexp20: | -2.28% | |
| Price / MAexp50: | -0.82% | |
| Price / MAexp100: | +1.61% |
News
Don't forget to follow the news on S&P500 INDEX. At the time of publication of this analysis, the latest news was as follows:
-
 S&P 500 Daily Price Forecast and Technical Analysis for December 11, 2024 #spx #trading #SP50
-
S&P 500 Daily Price Forecast and Technical Analysis for December 11, 2024 #spx #trading ##SP500
-
S&P 500 Daily Price Forecast and Technical Analysis for December 9, 2024 #spx #trading #sp500
-
S&P 500 Daily Forecast and Technical Analysis for December 2, 2024 #spx #trading #stockmarket #SP500
-
S&P 500 Forecast and Technical Analysis for November 25, 2024, by Chris Lewis for #spx #SP500
About author

Online


Add a comment
Comments
0 comments on the analysis S&P500 INDEX - Daily