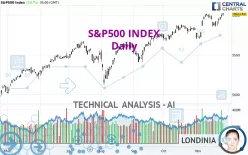
S&P500 INDEX - Daily - Technical analysis published on 11/27/2024 (GMT)
- 165
- 0
Click here for a new analysis!
- Timeframe : Daily
- - Analysis generated on
- Status : TARGET REACHED

Summary of the analysis

Additional analysis
Quotes
The S&P500 INDEX rating is 6,021.63 USD. The price has increased by +0.57% since the last closing and was between 5,992.27 USD and 6,025.42 USD. This implies that the price is at +0.49% from its lowest and at -0.06% from its highest.So that you have an overall view of the price change, here is a table showing the variations over several periods:
New HIGH record (5 years)
Type : Bullish
Timeframe : Weekly
New HIGH record (1 year)
Type : Bullish
Timeframe : Weekly
New HIGH record (1st january)
Type : Bullish
Timeframe : Weekly
New HIGH record (1 month)
Type : Bullish
Timeframe : Weekly
Technical
A technical analysis in Daily of this S&P500 INDEX chart shows a strongly bullish trend. 92.86% of the signals given by moving averages are bullish. This strongly bullish trend is supported by the strong bullish signals given by short-term moving averages. The Central Indicators scanner does not detect any result on moving averages that would impact this trend.
An assessment of technical indicators shows a strong bullish signal.
But beware of excesses. The Central Indicators scanner currently detects this:
Williams %R indicator is overbought : over -20
Type : Neutral
Timeframe : Daily
Pivot points : price is over resistance 1
Type : Neutral
Timeframe : Daily
Pivot points : price is over resistance 1
Type : Neutral
Timeframe : Weekly
The analysis of the price chart with Central Patterns scanners does not return any result.
No result was found by the Central Candlesticks scanner on Japanese candlesticks.
| S3 | S2 | S1 | Price | |
|---|---|---|---|---|
| ProTrendLines | 5,406.58 | 5,667.20 | 5,867.96 | 6,021.63 |
| Change (%) | -10.21% | -5.89% | -2.55% | - |
| Change | -615.05 | -354.43 | -153.67 | - |
| Level | Minor | Intermediate | Major | - |
To determine price objectives, it is also possible to use the pivot points. Here is the price position in relation to pivot points:
| Pivot points | S3 | S2 | S1 | PP | R1 | R2 | R3 |
|---|---|---|---|---|---|---|---|
| Standard | 5,967.64 | 5,979.96 | 6,000.79 | 6,013.11 | 6,033.94 | 6,046.26 | 6,067.09 |
| Camarilla | 6,012.51 | 6,015.55 | 6,018.59 | 6,021.63 | 6,024.67 | 6,027.71 | 6,030.75 |
| Woodie | 5,971.91 | 5,982.09 | 6,005.06 | 6,015.24 | 6,038.21 | 6,048.39 | 6,071.36 |
| Fibonacci | 5,979.96 | 5,992.62 | 6,000.44 | 6,013.11 | 6,025.77 | 6,033.59 | 6,046.26 |
| Pivot points | S3 | S2 | S1 | PP | R1 | R2 | R3 |
|---|---|---|---|---|---|---|---|
| Standard | 5,774.51 | 5,814.90 | 5,892.12 | 5,932.51 | 6,009.73 | 6,050.12 | 6,127.34 |
| Camarilla | 5,937.00 | 5,947.78 | 5,958.56 | 5,969.34 | 5,980.12 | 5,990.90 | 6,001.68 |
| Woodie | 5,792.93 | 5,824.11 | 5,910.54 | 5,941.72 | 6,028.15 | 6,059.33 | 6,145.76 |
| Fibonacci | 5,814.90 | 5,859.83 | 5,887.58 | 5,932.51 | 5,977.44 | 6,005.19 | 6,050.12 |
| Pivot points | S3 | S2 | S1 | PP | R1 | R2 | R3 |
|---|---|---|---|---|---|---|---|
| Standard | 5,422.35 | 5,548.18 | 5,626.81 | 5,752.64 | 5,831.27 | 5,957.10 | 6,035.73 |
| Camarilla | 5,649.22 | 5,667.97 | 5,686.71 | 5,705.45 | 5,724.19 | 5,742.93 | 5,761.68 |
| Woodie | 5,398.76 | 5,536.38 | 5,603.22 | 5,740.84 | 5,807.68 | 5,945.30 | 6,012.14 |
| Fibonacci | 5,548.18 | 5,626.28 | 5,674.53 | 5,752.64 | 5,830.74 | 5,878.99 | 5,957.10 |
Numerical data
The following are the details of the technical indicators and moving averages that were collected to generate this technical analysis:
| RSI (14): | 66.09 | |
| MACD (12,26,9): | 49.1800 | |
| Directional Movement: | 11.99 | |
| AROON (14): | 50.00 | |
| DEMA (21): | 5,982.79 | |
| Parabolic SAR (0,02-0,02-0,2): | 5,887.87 | |
| Elder Ray (13): | 66.12 | |
| Super Trend (3,10): | 5,841.51 | |
| Zig ZAG (10): | 6,021.63 | |
| VORTEX (21): | 1.0700 | |
| Stochastique (14,3,5): | 87.22 | |
| TEMA (21): | 5,987.52 | |
| Williams %R (14): | -2.20 | |
| Chande Momentum Oscillator (20): | 26.09 | |
| Repulse (5,40,3): | 1.0600 | |
| ROCnROLL: | 1 | |
| TRIX (15,9): | 0.1100 | |
| Courbe Coppock: | 3.98 |
| MA7: | 5,950.68 | |
| MA20: | 5,904.32 | |
| MA50: | 5,824.90 | |
| MA100: | 5,669.11 | |
| MAexp7: | 5,967.39 | |
| MAexp20: | 5,917.67 | |
| MAexp50: | 5,822.03 | |
| MAexp100: | 5,685.01 | |
| Price / MA7: | +1.19% | |
| Price / MA20: | +1.99% | |
| Price / MA50: | +3.38% | |
| Price / MA100: | +6.22% | |
| Price / MAexp7: | +0.91% | |
| Price / MAexp20: | +1.76% | |
| Price / MAexp50: | +3.43% | |
| Price / MAexp100: | +5.92% |
News
Don't forget to follow the news on S&P500 INDEX. At the time of publication of this analysis, the latest news was as follows:
-
 S&P 500 Forecast and Technical Analysis for November 25, 2024, by Chris Lewis for #spx #SP500
-
S&P 500 Forecast and Technical Analysis for November 14, 2024, by Chris Lewis for #spx #trading
-
Technical Analysis on US 500, Gold, EURGBP
-
S&P 500 Reacts to the US Election: S&P 500100 Daily Forecast and Technical Analysis (11/07) #sp500
-
Technical Analysis on EURJPY, US 500, Gold
About author

Online


Add a comment
Comments
0 comments on the analysis S&P500 INDEX - Daily