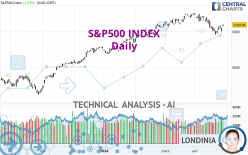
S&P500 INDEX - Daily - Technical analysis published on 04/29/2024 (GMT)
- 93
- 0
Click here for a new analysis!
- Timeframe : Daily
- - Analysis generated on
- Status : TARGET REACHED

Summary of the analysis

Additional analysis
Quotes
S&P500 INDEX rating 5,099.96 USD. The price registered an increase of +1.02% on the session with the lowest point at 5,073.14 USD and the highest point at 5,114.62 USD. The deviation from the price is +0.53% for the low point and -0.29% for the high point.The Central Gaps scanner detects a bullish gap which is a sign that buyers have taken the lead in the very short term.
Opening Gap UP
Type : Bullish
Timeframe : Openning
So that you have an overall view of the price change, here is a table showing the variations over several periods:
Near a new HIGH record (5 years)
Type : Bullish
Timeframe : Weekly
Near a new HIGH record (1 year)
Type : Bullish
Timeframe : Weekly
Near a new HIGH record (1st january)
Type : Bullish
Timeframe : Weekly
Near a new HIGH record (1 month)
Type : Bullish
Timeframe : Weekly
Technical
Technical analysis of this Daily chart of S&P500 INDEX indicates that the overall trend is bullish. 75.00% of the signals given by moving averages are bullish. Caution: the neutral signals currently given by short-term moving averages show us that the global trend is losing momentum. The Central Indicators scanner detects bullish and bearish signals on moving averages that could impact this trend:
Moving Average bearish crossovers : MA20 & MA50
Type : Bearish
Timeframe : Daily
Bullish price crossover with adaptative moving average 20
Type : Bullish
Timeframe : Daily
In fact, only 9 technical indicators out of 18 studied are currently bullish. Central Indicators, the scanner specialised in technical indicators, has identified these signals:
Pivot points : price is over resistance 2
Type : Neutral
Timeframe : Daily
Price is back over the pivot point
Type : Bullish
Timeframe : Weekly
Williams %R indicator is back over -50
Type : Bullish
Timeframe : Daily
The analysis of the price chart with Central Patterns scanners does not return any result.
For a small rebound in the very short term, the Central Candlesticks scanner currently notes the presence of this bullish pattern in Japanese candlesticks:
Upside gap
Type : Bullish
Timeframe : Daily
| S3 | S2 | S1 | Price | R1 | R2 | |
|---|---|---|---|---|---|---|
| ProTrendLines | 4,690.61 | 4,796.56 | 4,968.15 | 5,099.96 | 5,142.15 | 5,254.35 |
| Change (%) | -8.03% | -5.95% | -2.58% | - | +0.83% | +3.03% |
| Change | -409.35 | -303.40 | -131.81 | - | +42.19 | +154.39 |
| Level | Minor | Major | Major | - | Intermediate | Major |
Pivot points can also be used to set your price objectives. Here is the price situation in relation to pivot points:
| Pivot points | S3 | S2 | S1 | PP | R1 | R2 | R3 |
|---|---|---|---|---|---|---|---|
| Standard | 5,035.71 | 5,054.43 | 5,077.19 | 5,095.91 | 5,118.67 | 5,137.39 | 5,160.15 |
| Camarilla | 5,088.55 | 5,092.36 | 5,096.16 | 5,099.96 | 5,103.76 | 5,107.57 | 5,111.37 |
| Woodie | 5,037.74 | 5,055.44 | 5,079.22 | 5,096.92 | 5,120.70 | 5,138.40 | 5,162.18 |
| Fibonacci | 5,054.43 | 5,070.27 | 5,080.06 | 5,095.91 | 5,111.75 | 5,121.54 | 5,137.39 |
| Pivot points | S3 | S2 | S1 | PP | R1 | R2 | R3 |
|---|---|---|---|---|---|---|---|
| Standard | 4,862.81 | 4,916.11 | 5,008.03 | 5,061.33 | 5,153.25 | 5,206.55 | 5,298.47 |
| Camarilla | 5,060.03 | 5,073.34 | 5,086.65 | 5,099.96 | 5,113.27 | 5,126.58 | 5,139.90 |
| Woodie | 4,882.13 | 4,925.77 | 5,027.35 | 5,070.99 | 5,172.57 | 5,216.21 | 5,317.79 |
| Fibonacci | 4,916.11 | 4,971.58 | 5,005.85 | 5,061.33 | 5,116.80 | 5,151.07 | 5,206.55 |
| Pivot points | S3 | S2 | S1 | PP | R1 | R2 | R3 |
|---|---|---|---|---|---|---|---|
| Standard | 4,911.13 | 4,983.98 | 5,119.16 | 5,192.01 | 5,327.19 | 5,400.04 | 5,535.22 |
| Camarilla | 5,197.14 | 5,216.21 | 5,235.28 | 5,254.35 | 5,273.42 | 5,292.49 | 5,311.56 |
| Woodie | 4,942.31 | 4,999.56 | 5,150.34 | 5,207.59 | 5,358.37 | 5,415.62 | 5,566.40 |
| Fibonacci | 4,983.98 | 5,063.44 | 5,112.54 | 5,192.01 | 5,271.47 | 5,320.57 | 5,400.04 |
Numerical data
The following are the details of the technical indicators and moving averages that were collected to generate this technical analysis:
| RSI (14): | 49.75 | |
| MACD (12,26,9): | -26.1600 | |
| Directional Movement: | -6.71 | |
| AROON (14): | -57.15 | |
| DEMA (21): | 5,067.19 | |
| Parabolic SAR (0,02-0,02-0,2): | 4,958.94 | |
| Elder Ray (13): | 15.43 | |
| Super Trend (3,10): | 5,170.62 | |
| Zig ZAG (10): | 5,099.96 | |
| VORTEX (21): | 0.8100 | |
| Stochastique (14,3,5): | 44.16 | |
| TEMA (21): | 5,024.73 | |
| Williams %R (14): | -46.03 | |
| Chande Momentum Oscillator (20): | -60.68 | |
| Repulse (5,40,3): | 1.0400 | |
| ROCnROLL: | 1 | |
| TRIX (15,9): | -0.0600 | |
| Courbe Coppock: | 5.83 |
| MA7: | 5,039.93 | |
| MA20: | 5,116.15 | |
| MA50: | 5,124.33 | |
| MA100: | 4,959.74 | |
| MAexp7: | 5,064.13 | |
| MAexp20: | 5,095.21 | |
| MAexp50: | 5,077.07 | |
| MAexp100: | 4,954.82 | |
| Price / MA7: | +1.19% | |
| Price / MA20: | -0.32% | |
| Price / MA50: | -0.48% | |
| Price / MA100: | +2.83% | |
| Price / MAexp7: | +0.71% | |
| Price / MAexp20: | +0.09% | |
| Price / MAexp50: | +0.45% | |
| Price / MAexp100: | +2.93% |
News
The last news published on S&P500 INDEX at the time of the generation of this analysis was as follows:
-
 S&P 500 Forecast and Technical Analysis, April 25, 2024, by Chris Lewis #fxempire #trading #sp500
-
S&P 500 Forecast and Technical Analysis, April 18, 2024, by Chris Lewis #fxempire #trading #sp500
-
Midweek Technical Look: 18/04/2024 - EURUSD, US 500, WTI
-
S&P 500 Forecast and Technical Analysis, April 8, 2024, by Chris Lewis #fxempire #trading #sp500
-
S&P 500 Forecast and Technical Analysis, April 3, 2024, by Chris Lewis #fxempire #trading #sp500
About author

Online


Add a comment
Comments
0 comments on the analysis S&P500 INDEX - Daily