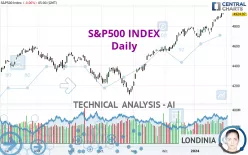
S&P500 INDEX - Daily - Technical analysis published on 01/31/2024 (GMT)
- 290
- 0
Click here for a new analysis!
- Timeframe : Daily
- - Analysis generated on
- Status : TARGET REACHED

Summary of the analysis

Additional analysis
Quotes
The S&P500 INDEX price is 4,924.97 USD. On the day, this instrument lost -0.06% and was traded between 4,916.27 USD and 4,931.09 USD over the period. The price is currently at +0.18% from its lowest and -0.12% from its highest.The Central Gaps scanner detects a bearish opening marking the presence of sellers ahead of buyers at the opening but not sufficiently marked to allow the price to register a quotation gap.
Bearish opening
Type : Bearish
Timeframe : Openning
So that you have an overall view of the price change, here is a table showing the variations over several periods:
New HIGH record (5 years)
Type : Bullish
Timeframe : Weekly
New HIGH record (1 year)
Type : Bullish
Timeframe : Weekly
New HIGH record (1st january)
Type : Bullish
Timeframe : Weekly
New HIGH record (1 month)
Type : Bullish
Timeframe : Weekly
Technical
A technical analysis in Daily of this S&P500 INDEX chart shows a strongly bullish trend. The signals given by the moving averages are 92.86% bullish. This strong bullish trend is confirmed by the strong signals currently being given by short-term moving averages. The Central Indicators scanner does not detect any result on moving averages that would impact this trend.
An assessment of technical indicators shows a strong bullish signal.
But beware of excesses. The Central Indicators scanner currently detects this:
RSI indicator is overbought : over 70
Type : Neutral
Timeframe : Daily
CCI indicator is overbought : over 100
Type : Neutral
Timeframe : Daily
Williams %R indicator is overbought : over -20
Type : Neutral
Timeframe : Daily
Pivot points : price is over resistance 1
Type : Neutral
Timeframe : Weekly
The analysis of the price chart with Central Patterns scanners does not return any result.
The presence of a bearish pattern in Japanese candlesticks detected by Central Candlesticks that could cause a correction in the very short term was also detected:
Bearish harami
Type : Bearish
Timeframe : Daily
| S3 | S2 | S1 | Price | |
|---|---|---|---|---|
| ProTrendLines | 4,373.66 | 4,589.59 | 4,796.56 | 4,924.97 |
| Change (%) | -11.19% | -6.81% | -2.61% | - |
| Change | -551.31 | -335.38 | -128.41 | - |
| Level | Minor | Minor | Major | - |
Attention could also be paid to pivot points to set price objectives:
| Pivot points | S3 | S2 | S1 | PP | R1 | R2 | R3 |
|---|---|---|---|---|---|---|---|
| Standard | 4,902.31 | 4,909.29 | 4,917.13 | 4,924.11 | 4,931.95 | 4,938.93 | 4,946.77 |
| Camarilla | 4,920.90 | 4,922.25 | 4,923.61 | 4,924.97 | 4,926.33 | 4,927.69 | 4,929.05 |
| Woodie | 4,902.74 | 4,909.51 | 4,917.56 | 4,924.33 | 4,932.38 | 4,939.15 | 4,947.20 |
| Fibonacci | 4,909.29 | 4,914.95 | 4,918.45 | 4,924.11 | 4,929.77 | 4,933.27 | 4,938.93 |
| Pivot points | S3 | S2 | S1 | PP | R1 | R2 | R3 |
|---|---|---|---|---|---|---|---|
| Standard | 4,791.81 | 4,817.93 | 4,854.45 | 4,880.57 | 4,917.09 | 4,943.21 | 4,979.73 |
| Camarilla | 4,873.74 | 4,879.49 | 4,885.23 | 4,890.97 | 4,896.71 | 4,902.45 | 4,908.20 |
| Woodie | 4,797.01 | 4,820.53 | 4,859.65 | 4,883.17 | 4,922.29 | 4,945.81 | 4,984.93 |
| Fibonacci | 4,817.93 | 4,841.86 | 4,856.64 | 4,880.57 | 4,904.50 | 4,919.28 | 4,943.21 |
| Pivot points | S3 | S2 | S1 | PP | R1 | R2 | R3 |
|---|---|---|---|---|---|---|---|
| Standard | 4,366.32 | 4,456.41 | 4,613.12 | 4,703.21 | 4,859.92 | 4,950.01 | 5,106.72 |
| Camarilla | 4,701.96 | 4,724.58 | 4,747.21 | 4,769.83 | 4,792.45 | 4,815.08 | 4,837.70 |
| Woodie | 4,399.63 | 4,473.07 | 4,646.43 | 4,719.87 | 4,893.23 | 4,966.67 | 5,140.03 |
| Fibonacci | 4,456.41 | 4,550.69 | 4,608.93 | 4,703.21 | 4,797.49 | 4,855.73 | 4,950.01 |
Numerical data
The following are the details of the technical indicators and moving averages that were collected to generate this technical analysis:
| RSI (14): | 74.69 | |
| MACD (12,26,9): | 62.1200 | |
| Directional Movement: | 24.77 | |
| AROON (14): | 64.29 | |
| DEMA (21): | 4,901.48 | |
| Parabolic SAR (0,02-0,02-0,2): | 4,822.97 | |
| Elder Ray (13): | 71.14 | |
| Super Trend (3,10): | 4,816.33 | |
| Zig ZAG (10): | 4,924.97 | |
| VORTEX (21): | 1.0900 | |
| Stochastique (14,3,5): | 96.31 | |
| TEMA (21): | 4,908.58 | |
| Williams %R (14): | -2.83 | |
| Chande Momentum Oscillator (20): | 144.73 | |
| Repulse (5,40,3): | 0.7900 | |
| ROCnROLL: | 1 | |
| TRIX (15,9): | 0.1600 | |
| Courbe Coppock: | 5.88 |
| MA7: | 4,888.80 | |
| MA20: | 4,802.43 | |
| MA50: | 4,703.94 | |
| MA100: | 4,520.42 | |
| MAexp7: | 4,887.16 | |
| MAexp20: | 4,820.67 | |
| MAexp50: | 4,707.46 | |
| MAexp100: | 4,588.96 | |
| Price / MA7: | +0.74% | |
| Price / MA20: | +2.55% | |
| Price / MA50: | +4.70% | |
| Price / MA100: | +8.95% | |
| Price / MAexp7: | +0.77% | |
| Price / MAexp20: | +2.16% | |
| Price / MAexp50: | +4.62% | |
| Price / MAexp100: | +7.32% |
News
Don't forget to follow the news on S&P500 INDEX. At the time of publication of this analysis, the latest news was as follows:
-
 Technical Analysis: 14/12/2023 - US 500 index surges to almost 2-year high
-
Weekly Technical Outlook: 20/11/2023 - US 500, GBPUSD, USDJPY
-
Technical Analysis: 15/11/2023 - US 500 index snaps downtrend
-
SP 500 Forecast August 7, 2023
-
Weekly Technical Analysis: 12/06/2023 - US 500, EURUSD, USDJPY
About author

Online


Add a comment
Comments
0 comments on the analysis S&P500 INDEX - Daily