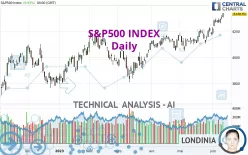
S&P500 INDEX - Daily - Technical analysis published on 06/13/2023 (GMT)
- 156
- 0
Click here for a new analysis!
- Timeframe : Daily
- - Analysis generated on
- Status : TARGET REACHED

Summary of the analysis

Additional analysis
Quotes
The S&P500 INDEX rating is 4,338.93 USD. The price registered an increase of +0.93% on the session and was between 4,304.37 USD and 4,340.13 USD. This implies that the price is at +0.80% from its lowest and at -0.03% from its highest.Here is a more detailed summary of the historical variations registered by S&P500 INDEX:
New HIGH record (1 year)
Type : Bullish
Timeframe : Weekly
New HIGH record (1st january)
Type : Bullish
Timeframe : Weekly
New HIGH record (1 month)
Type : Bullish
Timeframe : Weekly
Technical
Technical analysis of S&P500 INDEX in Daily shows a strongly overall bullish trend. The signals given by the moving averages are 92.86% bullish. This strong bullish trend is confirmed by the strong signals currently being given by short-term moving averages. There is no crossing of moving average by the price or crossing of moving averages between themselves.
In fact, 16 technical indicators on 18 studied are currently positioned bullish. But beware of excesses. The Central Indicators scanner currently detects this:
CCI indicator is overbought : over 100
Type : Neutral
Timeframe : Daily
Williams %R indicator is overbought : over -20
Type : Neutral
Timeframe : Daily
Pivot points : price is over resistance 1
Type : Neutral
Timeframe : Weekly
Pivot points : price is over resistance 2
Type : Neutral
Timeframe : Daily
Central Patterns, the scanner specializing in chart patterns, did not identify any signals.
The Central Candlesticks scanner which studies Japanese candlesticks did not detect anything.
| S3 | S2 | S1 | Price | R1 | |
|---|---|---|---|---|---|
| ProTrendLines | 4,022.19 | 4,113.10 | 4,305.20 | 4,338.93 | 4,796.56 |
| Change (%) | -7.30% | -5.20% | -0.78% | - | +10.55% |
| Change | -316.74 | -225.83 | -33.73 | - | +457.63 |
| Level | Minor | Major | Major | - | Major |
Attention could also be paid to pivot points to set price objectives:
| Pivot points | S3 | S2 | S1 | PP | R1 | R2 | R3 |
|---|---|---|---|---|---|---|---|
| Standard | 4,279.73 | 4,292.05 | 4,315.49 | 4,327.81 | 4,351.25 | 4,363.57 | 4,387.01 |
| Camarilla | 4,329.10 | 4,332.37 | 4,335.65 | 4,338.93 | 4,342.21 | 4,345.49 | 4,348.76 |
| Woodie | 4,285.29 | 4,294.83 | 4,321.05 | 4,330.59 | 4,356.81 | 4,366.35 | 4,392.57 |
| Fibonacci | 4,292.05 | 4,305.71 | 4,314.15 | 4,327.81 | 4,341.47 | 4,349.91 | 4,363.57 |
| Pivot points | S3 | S2 | S1 | PP | R1 | R2 | R3 |
|---|---|---|---|---|---|---|---|
| Standard | 4,204.20 | 4,232.63 | 4,265.75 | 4,294.18 | 4,327.30 | 4,355.73 | 4,388.85 |
| Camarilla | 4,281.93 | 4,287.58 | 4,293.22 | 4,298.86 | 4,304.50 | 4,310.14 | 4,315.79 |
| Woodie | 4,206.54 | 4,233.80 | 4,268.09 | 4,295.35 | 4,329.64 | 4,356.90 | 4,391.19 |
| Fibonacci | 4,232.63 | 4,256.15 | 4,270.67 | 4,294.18 | 4,317.70 | 4,332.22 | 4,355.73 |
| Pivot points | S3 | S2 | S1 | PP | R1 | R2 | R3 |
|---|---|---|---|---|---|---|---|
| Standard | 3,892.22 | 3,970.25 | 4,075.04 | 4,153.07 | 4,257.86 | 4,335.89 | 4,440.68 |
| Camarilla | 4,129.56 | 4,146.31 | 4,163.07 | 4,179.83 | 4,196.59 | 4,213.35 | 4,230.11 |
| Woodie | 3,905.60 | 3,976.94 | 4,088.42 | 4,159.76 | 4,271.24 | 4,342.58 | 4,454.06 |
| Fibonacci | 3,970.25 | 4,040.09 | 4,083.23 | 4,153.07 | 4,222.91 | 4,266.05 | 4,335.89 |
Numerical data
The following is the status of technical indicators and moving averages registered at the time this technical analysis was created:
| RSI (14): | 69.59 | |
| MACD (12,26,9): | 48.7200 | |
| Directional Movement: | 24.00 | |
| AROON (14): | 85.71 | |
| DEMA (21): | 4,287.50 | |
| Parabolic SAR (0,02-0,02-0,2): | 4,236.22 | |
| Elder Ray (13): | 67.56 | |
| Super Trend (3,10): | 4,197.96 | |
| Zig ZAG (10): | 4,338.93 | |
| VORTEX (21): | 1.1500 | |
| Stochastique (14,3,5): | 95.30 | |
| TEMA (21): | 4,309.84 | |
| Williams %R (14): | -0.51 | |
| Chande Momentum Oscillator (20): | 223.69 | |
| Repulse (5,40,3): | 1.1100 | |
| ROCnROLL: | 1 | |
| TRIX (15,9): | 0.1300 | |
| Courbe Coppock: | 6.10 |
| MA7: | 4,291.32 | |
| MA20: | 4,212.54 | |
| MA50: | 4,157.87 | |
| MA100: | 4,087.26 | |
| MAexp7: | 4,286.57 | |
| MAexp20: | 4,228.17 | |
| MAexp50: | 4,160.49 | |
| MAexp100: | 4,098.41 | |
| Price / MA7: | +1.11% | |
| Price / MA20: | +3.00% | |
| Price / MA50: | +4.35% | |
| Price / MA100: | +6.16% | |
| Price / MAexp7: | +1.22% | |
| Price / MAexp20: | +2.62% | |
| Price / MAexp50: | +4.29% | |
| Price / MAexp100: | +5.87% |
News
Don't forget to follow the news on S&P500 INDEX. At the time of publication of this analysis, the latest news was as follows:
-
 Weekly Technical Analysis: 12/06/2023 - US 500, EURUSD, USDJPY
-
XTB Market update on US500 - 21/03/2023
-
DXY, SP500 Slide as US Data Comes in Mixed | All Eyes on US Inflation Next Week
-
SP 500 and Risk Assets Consolidate as Technicals and Fundamentals Appear at Odds with Each Other
-
Inflation Story and Central Bank Repricing See SP500 and Risk Assets Struggle
About author

Online


Add a comment
Comments
0 comments on the analysis S&P500 INDEX - Daily