| Open: | 250.11 |
| Change: | -6.54 |
| Volume: | 185,042 |
| Low: | 243.92 |
| High: | 250.11 |
| High / Low range: | 6.19 |
| Type: | Indices |
| Ticker: | PSI20 |
| ISIN: | PTING0200002 |
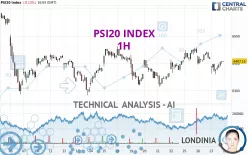
PSI20 INDEX - 1H - Technical analysis published on 11/27/2024 (GMT)
- 102
- 0
- 11/27/2024 - 16:20
Click here for a new analysis!
- Timeframe : 1H
- - Analysis generated on 11/27/2024 - 16:20
- Status : TARGET REACHED

Summary of the analysis

Additional analysis
Quotes
The PSI20 INDEX rating is 6,407.15 EUR. On the day, this instrument lost -0.13% and was between 6,358.67 EUR and 6,407.87 EUR. This implies that the price is at +0.76% from its lowest and at -0.01% from its highest.The Central Gaps scanner detects a bearish gap which is a sign that the sellers have taken the lead in the very short term.
Opening Gap DOWN
Type : Bearish
Timeframe : Openning
So that you have an overall view of the price change, here is a table showing the variations over several periods:
Near a new LOW record (1 year)
Type : Bearish
Timeframe : Weekly
Near a new LOW record (1st january)
Type : Bearish
Timeframe : Weekly
Near a new HIGH record (1 month)
Type : Bullish
Timeframe : Weekly
Technical
Technical analysis of this 1H chart of PSI20 INDEX indicates that the overall trend is bullish. 67.86% of the signals given by moving averages are bullish. This bullish trend shows slight signs of slowing down given the slightly bullish signals given by the short-term moving averages. An assessment of moving averages reveals several bullish signals that could impact this trend:
Bullish trend reversal : adaptative moving average 50
Type : Bullish
Timeframe : 1 hour
Bullish trend reversal : adaptative moving average 100
Type : Bullish
Timeframe : 1 hour
An assessment of technical indicators does not currently provide any relevant information to suggest whether the signal given by the technical indicators is more bullish or bearish.
No additional result has been identified by Central Indicators, the scanner specialised in technical indicators.
The analysis of the price chart with Central Patterns scanners does not return any result.
There is also a Japanese candlestick pattern detected by Central Candlesticks that could mark the end of the current short-term trend:
Doji
Type : Neutral
Timeframe : 1 hour
| S3 | S2 | S1 | Price | R1 | R2 | R3 | |
|---|---|---|---|---|---|---|---|
| ProTrendLines | 6,315.37 | 6,344.80 | 6,381.47 | 6,407.15 | 6,435.00 | 6,480.06 | 6,506.91 |
| Change (%) | -1.43% | -0.97% | -0.40% | - | +0.43% | +1.14% | +1.56% |
| Change | -91.78 | -62.35 | -25.68 | - | +27.85 | +72.91 | +99.76 |
| Level | Major | Major | Intermediate | - | Major | Minor | Minor |
To determine price objectives, it is also possible to use the pivot points. Here is the price position in relation to pivot points:
| Pivot points | S3 | S2 | S1 | PP | R1 | R2 | R3 |
|---|---|---|---|---|---|---|---|
| Standard | 6,344.82 | 6,370.00 | 6,392.70 | 6,417.88 | 6,440.58 | 6,465.76 | 6,488.46 |
| Camarilla | 6,402.23 | 6,406.62 | 6,411.01 | 6,415.40 | 6,419.79 | 6,424.18 | 6,428.57 |
| Woodie | 6,343.58 | 6,369.38 | 6,391.46 | 6,417.26 | 6,439.34 | 6,465.14 | 6,487.22 |
| Fibonacci | 6,370.00 | 6,388.29 | 6,399.59 | 6,417.88 | 6,436.17 | 6,447.47 | 6,465.76 |
| Pivot points | S3 | S2 | S1 | PP | R1 | R2 | R3 |
|---|---|---|---|---|---|---|---|
| Standard | 6,179.16 | 6,246.51 | 6,327.75 | 6,395.10 | 6,476.34 | 6,543.69 | 6,624.93 |
| Camarilla | 6,368.14 | 6,381.76 | 6,395.38 | 6,409.00 | 6,422.62 | 6,436.24 | 6,449.86 |
| Woodie | 6,186.12 | 6,249.98 | 6,334.71 | 6,398.57 | 6,483.30 | 6,547.16 | 6,631.89 |
| Fibonacci | 6,246.51 | 6,303.27 | 6,338.34 | 6,395.10 | 6,451.86 | 6,486.93 | 6,543.69 |
| Pivot points | S3 | S2 | S1 | PP | R1 | R2 | R3 |
|---|---|---|---|---|---|---|---|
| Standard | 5,938.77 | 6,159.96 | 6,346.36 | 6,567.55 | 6,753.95 | 6,975.14 | 7,161.54 |
| Camarilla | 6,420.68 | 6,458.05 | 6,495.41 | 6,532.77 | 6,570.13 | 6,607.50 | 6,644.86 |
| Woodie | 5,921.39 | 6,151.26 | 6,328.98 | 6,558.85 | 6,736.57 | 6,966.44 | 7,144.16 |
| Fibonacci | 6,159.96 | 6,315.66 | 6,411.85 | 6,567.55 | 6,723.25 | 6,819.44 | 6,975.14 |
Numerical data
The following is the status of the technical indicators and moving averages at the time of publication of this technical analysis:
| RSI (14): | 49.58 | |
| MACD (12,26,9): | -3.3500 | |
| Directional Movement: | -4.30 | |
| AROON (14): | -42.86 | |
| DEMA (21): | 6,401.92 | |
| Parabolic SAR (0,02-0,02-0,2): | 6,426.62 | |
| Elder Ray (13): | 1.42 | |
| Super Trend (3,10): | 6,430.83 | |
| Zig ZAG (10): | 6,403.57 | |
| VORTEX (21): | 1.0500 | |
| Stochastique (14,3,5): | 49.46 | |
| TEMA (21): | 6,393.92 | |
| Williams %R (14): | -42.23 | |
| Chande Momentum Oscillator (20): | -24.53 | |
| Repulse (5,40,3): | 0.3900 | |
| ROCnROLL: | 1 | |
| TRIX (15,9): | 0.0000 | |
| Courbe Coppock: | 0.97 |
| MA7: | 6,391.88 | |
| MA20: | 6,416.91 | |
| MA50: | 6,564.54 | |
| MA100: | 6,636.51 | |
| MAexp7: | 6,399.94 | |
| MAexp20: | 6,403.41 | |
| MAexp50: | 6,400.18 | |
| MAexp100: | 6,402.97 | |
| Price / MA7: | +0.24% | |
| Price / MA20: | -0.15% | |
| Price / MA50: | -2.40% | |
| Price / MA100: | -3.46% | |
| Price / MAexp7: | +0.11% | |
| Price / MAexp20: | +0.06% | |
| Price / MAexp50: | +0.11% | |
| Price / MAexp100: | +0.07% |
About author
Online


Add a comment
Comments
0 comments on the analysis PSI20 INDEX - 1H