NASDAQ COMPOSITE INDEX - Daily - Technical analysis published on 06/26/2024 (GMT)
- 390
- 0
Click here for a new analysis!
- Timeframe : Daily
- - Analysis generated on
- Status : TARGET REACHED
Summary of the analysis

Additional analysis
Quotes
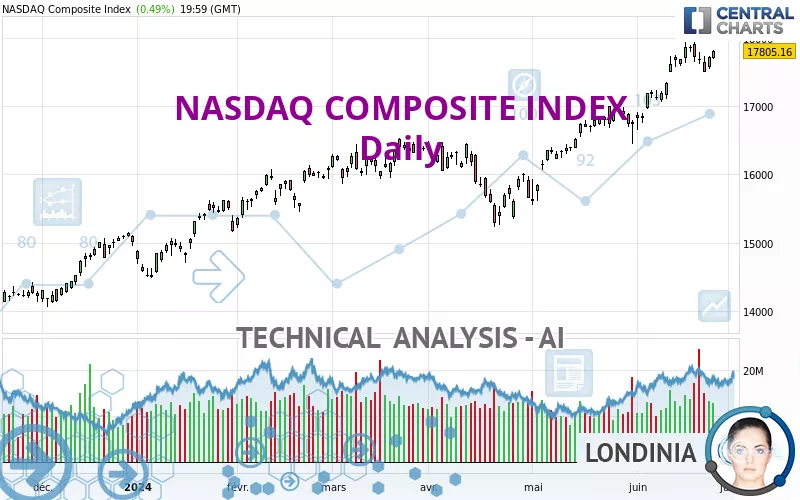
NASDAQ COMPOSITE INDEX rating 17,805.16 USD. On the day, this instrument gained +0.49% and was traded between 17,687.07 USD and 17,813.55 USD over the period. The price is currently at +0.67% from its lowest and -0.05% from its highest.The Central Gaps scanner detects a bearish opening. A small advantage for sellers in the very short term.
Bearish opening
Type : Bearish
Timeframe : Openning
A study of price movements over other periods shows the following variations:
Near a new HIGH record (5 years)
Type : Bullish
Timeframe : Weekly
Near a new HIGH record (1 year)
Type : Bullish
Timeframe : Weekly
Near a new HIGH record (1st january)
Type : Bullish
Timeframe : Weekly
Near a new HIGH record (1 month)
Type : Bullish
Timeframe : Weekly
Technical
Technical analysis of NASDAQ COMPOSITE INDEX in Daily shows a strongly overall bullish trend. 92.86% of the signals given by moving averages are bullish. The overall trend is supported by the strong bullish signals from short-term moving averages. The Central Indicators scanner does not detect any result on moving averages that would impact this trend.
The probability of a further increase is slight given the direction of the technical indicators.
But beware of excesses. The Central Indicators scanner currently detects this:
Williams %R indicator is overbought : over -20
Type : Neutral
Timeframe : Daily
Pivot points : price is over resistance 1
Type : Neutral
Timeframe : Daily
Price is back over the pivot point
Type : Bullish
Timeframe : Weekly
The analysis of the price chart with Central Patterns scanners does not return any result.
The Central Candlesticks scanner, specialised in Japanese candlesticks, did not identify any signals.
| S3 | S2 | S1 | Price | R1 | |
|---|---|---|---|---|---|
| ProTrendLines | 13,659.68 | 14,348.78 | 16,057.40 | 17,805.16 | 17,862.23 |
| Change (%) | -23.28% | -19.41% | -9.82% | - | +0.32% |
| Change | -4,145.48 | -3,456.38 | -1,747.76 | - | +57.07 |
| Level | Minor | Major | Major | - | Major |
To determine price objectives, it is also possible to use the pivot points. Here is the price position in relation to pivot points:
| Pivot points | S3 | S2 | S1 | PP | R1 | R2 | R3 |
|---|---|---|---|---|---|---|---|
| Standard | 17,597.16 | 17,642.11 | 17,723.64 | 17,768.59 | 17,850.12 | 17,895.07 | 17,976.60 |
| Camarilla | 17,770.38 | 17,781.97 | 17,793.57 | 17,805.16 | 17,816.75 | 17,828.35 | 17,839.94 |
| Woodie | 17,615.44 | 17,651.26 | 17,741.92 | 17,777.74 | 17,868.40 | 17,904.22 | 17,994.88 |
| Fibonacci | 17,642.11 | 17,690.43 | 17,720.28 | 17,768.59 | 17,816.91 | 17,846.76 | 17,895.07 |
| Pivot points | S3 | S2 | S1 | PP | R1 | R2 | R3 |
|---|---|---|---|---|---|---|---|
| Standard | 17,244.80 | 17,432.69 | 17,561.02 | 17,748.91 | 17,877.24 | 18,065.13 | 18,193.46 |
| Camarilla | 17,602.40 | 17,631.39 | 17,660.37 | 17,689.36 | 17,718.35 | 17,747.33 | 17,776.32 |
| Woodie | 17,215.03 | 17,417.80 | 17,531.25 | 17,734.02 | 17,847.47 | 18,050.24 | 18,163.69 |
| Fibonacci | 17,432.69 | 17,553.48 | 17,628.11 | 17,748.91 | 17,869.70 | 17,944.33 | 18,065.13 |
| Pivot points | S3 | S2 | S1 | PP | R1 | R2 | R3 |
|---|---|---|---|---|---|---|---|
| Standard | 14,375.87 | 14,966.75 | 15,850.89 | 16,441.77 | 17,325.91 | 17,916.79 | 18,800.93 |
| Camarilla | 16,329.39 | 16,464.60 | 16,599.81 | 16,735.02 | 16,870.23 | 17,005.44 | 17,140.65 |
| Woodie | 14,522.49 | 15,040.07 | 15,997.51 | 16,515.09 | 17,472.53 | 17,990.11 | 18,947.55 |
| Fibonacci | 14,966.75 | 15,530.21 | 15,878.32 | 16,441.77 | 17,005.23 | 17,353.34 | 17,916.79 |
Numerical data
The following is the status of the technical indicators and moving averages at the time of publication of this technical analysis:
| RSI (14): | 68.63 | |
| MACD (12,26,9): | 304.7500 | |
| Directional Movement: | 13.83 | |
| AROON (14): | 71.43 | |
| DEMA (21): | 17,812.71 | |
| Parabolic SAR (0,02-0,02-0,2): | 17,492.41 | |
| Elder Ray (13): | 188.72 | |
| Super Trend (3,10): | 17,248.03 | |
| Zig ZAG (10): | 17,805.16 | |
| VORTEX (21): | 1.1300 | |
| Stochastique (14,3,5): | 75.20 | |
| TEMA (21): | 17,882.50 | |
| Williams %R (14): | -14.97 | |
| Chande Momentum Oscillator (20): | 672.03 | |
| Repulse (5,40,3): | 0.8700 | |
| ROCnROLL: | 1 | |
| TRIX (15,9): | 0.2700 | |
| Courbe Coppock: | 8.82 |
| MA7: | 17,735.69 | |
| MA20: | 17,361.17 | |
| MA50: | 16,662.06 | |
| MA100: | 16,366.92 | |
| MAexp7: | 17,683.28 | |
| MAexp20: | 17,403.84 | |
| MAexp50: | 16,901.53 | |
| MAexp100: | 16,363.97 | |
| Price / MA7: | +0.39% | |
| Price / MA20: | +2.56% | |
| Price / MA50: | +6.86% | |
| Price / MA100: | +8.79% | |
| Price / MAexp7: | +0.69% | |
| Price / MAexp20: | +2.31% | |
| Price / MAexp50: | +5.35% | |
| Price / MAexp100: | +8.81% |
News
Don't forget to follow the news on NASDAQ COMPOSITE INDEX. At the time of publication of this analysis, the latest news was as follows:
-
 Nasdaq Composite officially entered bear market
-
Nasdaq Composite Courts Bear Market Territory
-
S&P 500 And Nasdaq Composite Close To Record Highs
-
Biotech Boosts S&P 500 And Nasdaq Composite
-
Nasdaq Composite Hits Record High
About author

Online


Add a comment
Comments
0 comments on the analysis NASDAQ COMPOSITE INDEX - Daily