NASDAQ COMPOSITE INDEX - Daily - Technical analysis published on 06/25/2024 (GMT)
- 455
- 0
Click here for a new analysis!
- Timeframe : Daily
- - Analysis generated on
- Status : TARGET REACHED
Summary of the analysis

Additional analysis
Quotes
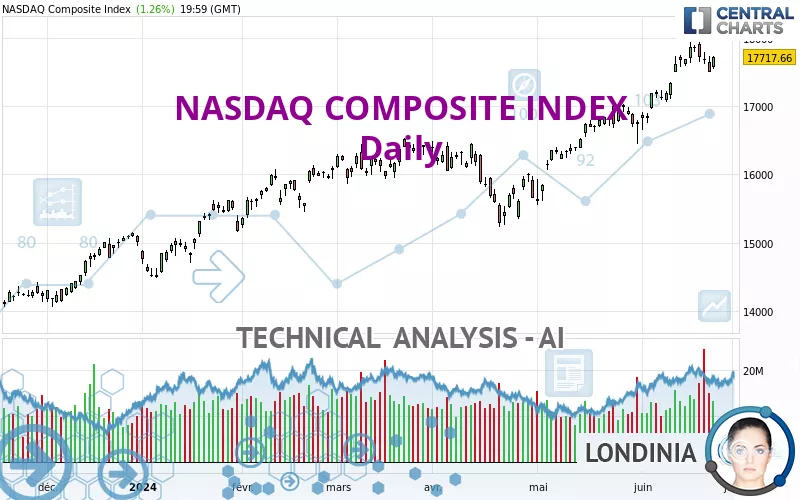
The NASDAQ COMPOSITE INDEX rating is 17,717.65 USD. On the day, this instrument gained +1.26% and was traded between 17,546.63 USD and 17,734.34 USD over the period. The price is currently at +0.97% from its lowest and -0.09% from its highest.A bullish opening was detected by the Central Gaps scanner. Buyers are trying to impose a bullish momentum in the very short term.
Bullish opening
Type : Bullish
Timeframe : Openning
So that you have an overall view of the price change, here is a table showing the variations over several periods:
Near a new HIGH record (5 years)
Type : Bullish
Timeframe : Weekly
Near a new HIGH record (1 year)
Type : Bullish
Timeframe : Weekly
Near a new HIGH record (1st january)
Type : Bullish
Timeframe : Weekly
Near a new HIGH record (1 month)
Type : Bullish
Timeframe : Weekly
Technical
Technical analysis of this Daily chart of NASDAQ COMPOSITE INDEX indicates that the overall trend is strongly bullish. 92.86% of the signals given by moving averages are bullish. This strongly bullish trend is supported by the strong bullish signals given by short-term moving averages. The Central Indicators scanner does not detect any result on moving averages that would impact this trend.
In fact, 11 technical indicators on 18 studied are currently positioned bullish. Central Indicators, the scanner specialised in technical indicators, has identified these signals:
Pivot points : price is over resistance 1
Type : Neutral
Timeframe : Daily
MACD crosses DOWN its Moving Average
Type : Bearish
Timeframe : Daily
The analysis of the price chart with Central Patterns scanners does not return any result.
The Central Candlesticks scanner, specialised in Japanese candlesticks, did not identify any signals.
| S3 | S2 | S1 | Price | |
|---|---|---|---|---|
| ProTrendLines | 15,282.01 | 16,057.40 | 16,437.74 | 17,717.65 |
| Change (%) | -13.75% | -9.37% | -7.22% | - |
| Change | -2,435.64 | -1,660.25 | -1,279.91 | - |
| Level | Intermediate | Major | Major | - |
Pivot points can also be used to set your price objectives. Here is the price situation in relation to pivot points:
| Pivot points | S3 | S2 | S1 | PP | R1 | R2 | R3 |
|---|---|---|---|---|---|---|---|
| Standard | 17,410.36 | 17,478.50 | 17,598.07 | 17,666.21 | 17,785.78 | 17,853.92 | 17,973.49 |
| Camarilla | 17,666.03 | 17,683.24 | 17,700.44 | 17,717.65 | 17,734.86 | 17,752.06 | 17,769.27 |
| Woodie | 17,436.09 | 17,491.36 | 17,623.80 | 17,679.07 | 17,811.51 | 17,866.78 | 17,999.22 |
| Fibonacci | 17,478.50 | 17,550.20 | 17,594.50 | 17,666.21 | 17,737.91 | 17,782.21 | 17,853.92 |
| Pivot points | S3 | S2 | S1 | PP | R1 | R2 | R3 |
|---|---|---|---|---|---|---|---|
| Standard | 17,244.80 | 17,432.69 | 17,561.02 | 17,748.91 | 17,877.24 | 18,065.13 | 18,193.46 |
| Camarilla | 17,602.40 | 17,631.39 | 17,660.37 | 17,689.36 | 17,718.35 | 17,747.33 | 17,776.32 |
| Woodie | 17,215.03 | 17,417.80 | 17,531.25 | 17,734.02 | 17,847.47 | 18,050.24 | 18,163.69 |
| Fibonacci | 17,432.69 | 17,553.48 | 17,628.11 | 17,748.91 | 17,869.70 | 17,944.33 | 18,065.13 |
| Pivot points | S3 | S2 | S1 | PP | R1 | R2 | R3 |
|---|---|---|---|---|---|---|---|
| Standard | 14,375.87 | 14,966.75 | 15,850.89 | 16,441.77 | 17,325.91 | 17,916.79 | 18,800.93 |
| Camarilla | 16,329.39 | 16,464.60 | 16,599.81 | 16,735.02 | 16,870.23 | 17,005.44 | 17,140.65 |
| Woodie | 14,522.49 | 15,040.07 | 15,997.51 | 16,515.09 | 17,472.53 | 17,990.11 | 18,947.55 |
| Fibonacci | 14,966.75 | 15,530.21 | 15,878.32 | 16,441.77 | 17,005.23 | 17,353.34 | 17,916.79 |
Numerical data
The following are the details of the technical indicators and moving averages that were collected to generate this technical analysis:
| RSI (14): | 66.78 | |
| MACD (12,26,9): | 306.6100 | |
| Directional Movement: | 11.55 | |
| AROON (14): | 78.57 | |
| DEMA (21): | 17,771.16 | |
| Parabolic SAR (0,02-0,02-0,2): | 17,420.07 | |
| Elder Ray (13): | 119.50 | |
| Super Trend (3,10): | 17,248.03 | |
| Zig ZAG (10): | 17,717.65 | |
| VORTEX (21): | 1.1100 | |
| Stochastique (14,3,5): | 73.80 | |
| TEMA (21): | 17,848.69 | |
| Williams %R (14): | -22.33 | |
| Chande Momentum Oscillator (20): | 544.53 | |
| Repulse (5,40,3): | 0.0800 | |
| ROCnROLL: | 1 | |
| TRIX (15,9): | 0.2700 | |
| Courbe Coppock: | 9.18 |
| MA7: | 17,719.08 | |
| MA20: | 17,321.90 | |
| MA50: | 16,623.66 | |
| MA100: | 16,342.48 | |
| MAexp7: | 17,642.65 | |
| MAexp20: | 17,361.60 | |
| MAexp50: | 16,864.64 | |
| MAexp100: | 16,334.84 | |
| Price / MA7: | -0.01% | |
| Price / MA20: | +2.28% | |
| Price / MA50: | +6.58% | |
| Price / MA100: | +8.41% | |
| Price / MAexp7: | +0.43% | |
| Price / MAexp20: | +2.05% | |
| Price / MAexp50: | +5.06% | |
| Price / MAexp100: | +8.47% |
News
Don't forget to follow the news on NASDAQ COMPOSITE INDEX. At the time of publication of this analysis, the latest news was as follows:
-
 Nasdaq Composite officially entered bear market
-
Nasdaq Composite Courts Bear Market Territory
-
S&P 500 And Nasdaq Composite Close To Record Highs
-
Biotech Boosts S&P 500 And Nasdaq Composite
-
Nasdaq Composite Hits Record High
About author

Online


Add a comment
Comments
0 comments on the analysis NASDAQ COMPOSITE INDEX - Daily