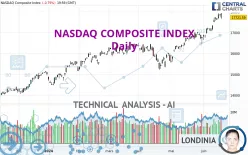
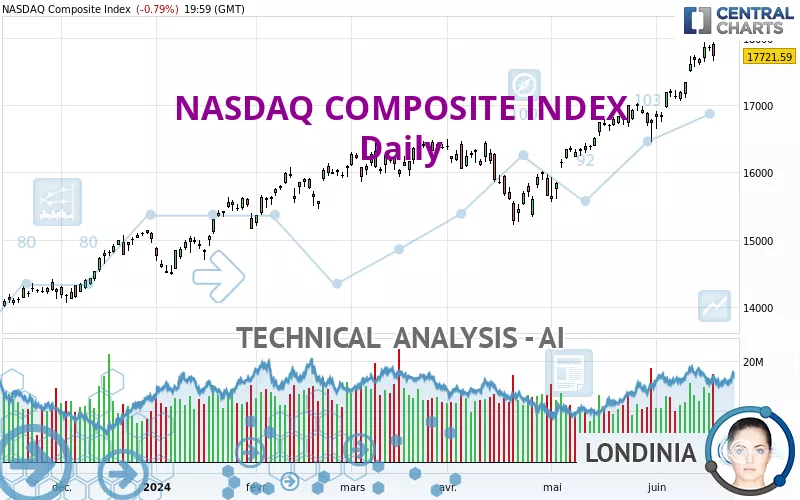
NASDAQ COMPOSITE INDEX - Daily - Technical analysis published on 06/20/2024 (GMT)
- 280
- 0
Click here for a new analysis!
- Timeframe : Daily
- - Analysis generated on
- Status : TARGET REACHED
Summary of the analysis

Additional analysis
Quotes
The NASDAQ COMPOSITE INDEX price is 17,721.59 USD. The price is lower by -0.79% since the last closing and was between 17,650.70 USD and 17,936.79 USD. This implies that the price is at +0.40% from its lowest and at -1.20% from its highest.The Central Gaps scanner detects a bullish gap which is a sign that buyers have taken the lead in the very short term.
Opening Gap UP
Type : Bullish
Timeframe : Openning
So that you have an overall view of the price change, here is a table showing the variations over several periods:
New HIGH record (5 years)
Type : Bullish
Timeframe : Weekly
New HIGH record (1 year)
Type : Bullish
Timeframe : Weekly
New HIGH record (1st january)
Type : Bullish
Timeframe : Weekly
New HIGH record (1 month)
Type : Bullish
Timeframe : Weekly
Technical
Technical analysis of this Daily chart of NASDAQ COMPOSITE INDEX indicates that the overall trend is strongly bullish. 92.86% of the signals given by moving averages are bullish. The overall trend is supported by the strong bullish signals from short-term moving averages. The Central Indicators market scanner is currently detecting a bullish signal that could impact this trend:
Moving Average bullish crossovers : AMA50 & AMA100
Type : Bullish
Timeframe : Daily
Technical indicators are strongly bullish, suggesting that the price increase should continue.
Caution: the Central Indicators scanner currently detects an excess:
RSI indicator is overbought : over 70
Type : Neutral
Timeframe : Daily
CCI indicator is overbought : over 100
Type : Neutral
Timeframe : Daily
Williams %R indicator is overbought : over -20
Type : Neutral
Timeframe : Daily
Pivot points : price is under support 3
Type : Neutral
Timeframe : Daily
Central Patterns, the scanner specializing in chart patterns, did not identify any signals.
For a small setback in the very short term, the Central Candlesticks scanner currently notes the presence of this bearish pattern in Japanese candlesticks:
Bearish engulfing lines
Type : Bearish
Timeframe : Daily
| S3 | S2 | S1 | Price | |
|---|---|---|---|---|
| ProTrendLines | 15,282.01 | 16,057.40 | 16,437.74 | 17,721.59 |
| Change (%) | -13.77% | -9.39% | -7.24% | - |
| Change | -2,439.58 | -1,664.19 | -1,283.85 | - |
| Level | Intermediate | Major | Major | - |
Pivot points can also be used to set your price objectives. Here is the price situation in relation to pivot points:
| Pivot points | S3 | S2 | S1 | PP | R1 | R2 | R3 |
|---|---|---|---|---|---|---|---|
| Standard | 17,316.51 | 17,483.60 | 17,602.60 | 17,769.69 | 17,888.69 | 18,055.78 | 18,174.78 |
| Camarilla | 17,642.92 | 17,669.14 | 17,695.37 | 17,721.59 | 17,747.82 | 17,774.04 | 17,800.27 |
| Woodie | 17,292.46 | 17,471.58 | 17,578.55 | 17,757.67 | 17,864.64 | 18,043.76 | 18,150.73 |
| Fibonacci | 17,483.60 | 17,592.89 | 17,660.41 | 17,769.69 | 17,878.98 | 17,946.50 | 18,055.78 |
| Pivot points | S3 | S2 | S1 | PP | R1 | R2 | R3 |
|---|---|---|---|---|---|---|---|
| Standard | 16,565.75 | 16,811.55 | 17,250.21 | 17,496.01 | 17,934.67 | 18,180.47 | 18,619.13 |
| Camarilla | 17,500.65 | 17,563.40 | 17,626.14 | 17,688.88 | 17,751.62 | 17,814.36 | 17,877.11 |
| Woodie | 16,662.19 | 16,859.77 | 17,346.65 | 17,544.23 | 18,031.11 | 18,228.69 | 18,715.57 |
| Fibonacci | 16,811.55 | 17,073.01 | 17,234.54 | 17,496.01 | 17,757.47 | 17,919.00 | 18,180.47 |
| Pivot points | S3 | S2 | S1 | PP | R1 | R2 | R3 |
|---|---|---|---|---|---|---|---|
| Standard | 14,375.87 | 14,966.75 | 15,850.89 | 16,441.77 | 17,325.91 | 17,916.79 | 18,800.93 |
| Camarilla | 16,329.39 | 16,464.60 | 16,599.81 | 16,735.02 | 16,870.23 | 17,005.44 | 17,140.65 |
| Woodie | 14,522.49 | 15,040.07 | 15,997.51 | 16,515.09 | 17,472.53 | 17,990.11 | 18,947.55 |
| Fibonacci | 14,966.75 | 15,530.21 | 15,878.32 | 16,441.77 | 17,005.23 | 17,353.34 | 17,916.79 |
Numerical data
The following is the status of the technical indicators and moving averages at the time of publication of this technical analysis:
| RSI (14): | 72.28 | |
| MACD (12,26,9): | 349.5100 | |
| Directional Movement: | 20.56 | |
| AROON (14): | 92.86 | |
| DEMA (21): | 17,708.18 | |
| Parabolic SAR (0,02-0,02-0,2): | 17,124.41 | |
| Elder Ray (13): | 340.73 | |
| Super Trend (3,10): | 17,248.03 | |
| Zig ZAG (10): | 17,721.59 | |
| VORTEX (21): | 1.1400 | |
| Stochastique (14,3,5): | 91.77 | |
| TEMA (21): | 17,849.86 | |
| Williams %R (14): | -14.43 | |
| Chande Momentum Oscillator (20): | 892.92 | |
| Repulse (5,40,3): | -0.2200 | |
| ROCnROLL: | 1 | |
| TRIX (15,9): | 0.2600 | |
| Courbe Coppock: | 9.69 |
| MA7: | 17,678.47 | |
| MA20: | 17,199.63 | |
| MA50: | 16,541.33 | |
| MA100: | 16,276.46 | |
| MAexp7: | 17,647.45 | |
| MAexp20: | 17,265.58 | |
| MAexp50: | 16,766.40 | |
| MAexp100: | 16,254.54 | |
| Price / MA7: | +0.24% | |
| Price / MA20: | +3.03% | |
| Price / MA50: | +7.14% | |
| Price / MA100: | +8.88% | |
| Price / MAexp7: | +0.42% | |
| Price / MAexp20: | +2.64% | |
| Price / MAexp50: | +5.70% | |
| Price / MAexp100: | +9.03% |
News
The last news published on NASDAQ COMPOSITE INDEX at the time of the generation of this analysis was as follows:
-
 Nasdaq Composite officially entered bear market
-
Nasdaq Composite Courts Bear Market Territory
-
S&P 500 And Nasdaq Composite Close To Record Highs
-
Biotech Boosts S&P 500 And Nasdaq Composite
-
Nasdaq Composite Hits Record High
About author

Online


Add a comment
Comments
0 comments on the analysis NASDAQ COMPOSITE INDEX - Daily