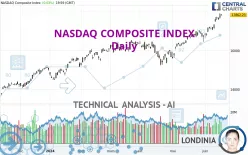
NASDAQ COMPOSITE INDEX - Daily - Technical analysis published on 06/18/2024 (GMT)
- 329
- 0
Click here for a new analysis!
- Timeframe : Daily
- - Analysis generated on
- Status : LEVEL MAINTAINED
Summary of the analysis

Additional analysis
Quotes
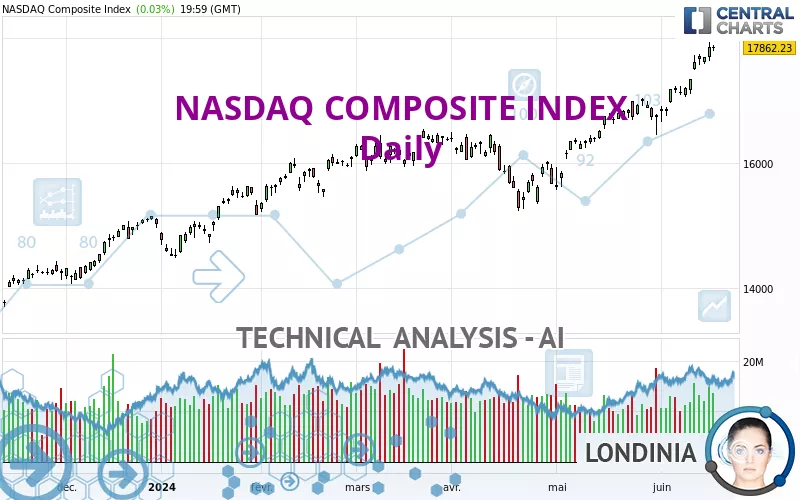
The NASDAQ COMPOSITE INDEX rating is 17,862.23 USD. The price has increased by +0.03% since the last closing with the lowest point at 17,796.88 USD and the highest point at 17,890.52 USD. The deviation from the price is +0.37% for the low point and -0.16% for the high point.A bearish opening was detected by the Central Gaps scanner. Sellers are trying to impose a bearish trend in the very short term.
Bearish opening
Type : Bearish
Timeframe : Openning
A study of price movements over other periods shows the following variations:
New HIGH record (5 years)
Type : Bullish
Timeframe : Weekly
Near a new HIGH record (1 year)
Type : Bullish
Timeframe : Weekly
Near a new HIGH record (1st january)
Type : Bullish
Timeframe : Weekly
Near a new HIGH record (1 month)
Type : Bullish
Timeframe : Weekly
Technical
Technical analysis of this Daily chart of NASDAQ COMPOSITE INDEX indicates that the overall trend is strongly bullish. The signals given by the moving averages are 92.86% bullish. This strong bullish trend is confirmed by the strong signals currently being given by short-term moving averages. The Central Indicators scanner does not detect any result on moving averages that would impact this trend.
In fact, 16 technical indicators on 18 studied are currently positioned bullish. Caution: the Central Indicators scanner currently detects an excess:
RSI indicator is overbought : over 70
Type : Neutral
Timeframe : Daily
CCI indicator is overbought : over 100
Type : Neutral
Timeframe : Daily
CCI indicator: bearish divergence
Type : Bearish
Timeframe : Daily
Williams %R indicator is overbought : over -20
Type : Neutral
Timeframe : Daily
The analysis of the price chart with Central Patterns scanners does not return any result.
The Central Candlesticks scanner which studies Japanese candlesticks did not detect anything.
| S3 | S2 | S1 | Price | |
|---|---|---|---|---|
| ProTrendLines | 15,282.01 | 16,057.40 | 16,437.74 | 17,862.23 |
| Change (%) | -14.45% | -10.10% | -7.97% | - |
| Change | -2,580.22 | -1,804.83 | -1,424.49 | - |
| Level | Intermediate | Major | Major | - |
Attention could also be paid to pivot points to set price objectives:
| Pivot points | S3 | S2 | S1 | PP | R1 | R2 | R3 |
|---|---|---|---|---|---|---|---|
| Standard | 17,715.59 | 17,756.24 | 17,809.23 | 17,849.88 | 17,902.87 | 17,943.52 | 17,996.51 |
| Camarilla | 17,836.48 | 17,845.06 | 17,853.65 | 17,862.23 | 17,870.81 | 17,879.40 | 17,887.98 |
| Woodie | 17,721.77 | 17,759.33 | 17,815.41 | 17,852.97 | 17,909.05 | 17,946.61 | 18,002.69 |
| Fibonacci | 17,756.24 | 17,792.01 | 17,814.11 | 17,849.88 | 17,885.65 | 17,907.75 | 17,943.52 |
| Pivot points | S3 | S2 | S1 | PP | R1 | R2 | R3 |
|---|---|---|---|---|---|---|---|
| Standard | 16,565.75 | 16,811.55 | 17,250.21 | 17,496.01 | 17,934.67 | 18,180.47 | 18,619.13 |
| Camarilla | 17,500.65 | 17,563.40 | 17,626.14 | 17,688.88 | 17,751.62 | 17,814.36 | 17,877.11 |
| Woodie | 16,662.19 | 16,859.77 | 17,346.65 | 17,544.23 | 18,031.11 | 18,228.69 | 18,715.57 |
| Fibonacci | 16,811.55 | 17,073.01 | 17,234.54 | 17,496.01 | 17,757.47 | 17,919.00 | 18,180.47 |
| Pivot points | S3 | S2 | S1 | PP | R1 | R2 | R3 |
|---|---|---|---|---|---|---|---|
| Standard | 14,375.87 | 14,966.75 | 15,850.89 | 16,441.77 | 17,325.91 | 17,916.79 | 18,800.93 |
| Camarilla | 16,329.39 | 16,464.60 | 16,599.81 | 16,735.02 | 16,870.23 | 17,005.44 | 17,140.65 |
| Woodie | 14,522.49 | 15,040.07 | 15,997.51 | 16,515.09 | 17,472.53 | 17,990.11 | 18,947.55 |
| Fibonacci | 14,966.75 | 15,530.21 | 15,878.32 | 16,441.77 | 17,005.23 | 17,353.34 | 17,916.79 |
Numerical data
The following is the status of technical indicators and moving averages registered at the time this technical analysis was created:
| RSI (14): | 79.93 | |
| MACD (12,26,9): | 353.2000 | |
| Directional Movement: | 28.44 | |
| AROON (14): | 78.57 | |
| DEMA (21): | 17,658.87 | |
| Parabolic SAR (0,02-0,02-0,2): | 17,013.74 | |
| Elder Ray (13): | 435.44 | |
| Super Trend (3,10): | 17,248.03 | |
| Zig ZAG (10): | 17,862.23 | |
| VORTEX (21): | 1.2000 | |
| Stochastique (14,3,5): | 95.22 | |
| TEMA (21): | 17,813.38 | |
| Williams %R (14): | -4.95 | |
| Chande Momentum Oscillator (20): | 1,127.21 | |
| Repulse (5,40,3): | 1.5600 | |
| ROCnROLL: | 1 | |
| TRIX (15,9): | 0.2600 | |
| Courbe Coppock: | 9.08 |
| MA7: | 17,602.89 | |
| MA20: | 17,155.18 | |
| MA50: | 16,513.04 | |
| MA100: | 16,253.80 | |
| MAexp7: | 17,622.74 | |
| MAexp20: | 17,217.58 | |
| MAexp50: | 16,727.41 | |
| MAexp100: | 16,224.82 | |
| Price / MA7: | +1.47% | |
| Price / MA20: | +4.12% | |
| Price / MA50: | +8.17% | |
| Price / MA100: | +9.90% | |
| Price / MAexp7: | +1.36% | |
| Price / MAexp20: | +3.74% | |
| Price / MAexp50: | +6.78% | |
| Price / MAexp100: | +10.09% |
News
Don't forget to follow the news on NASDAQ COMPOSITE INDEX. At the time of publication of this analysis, the latest news was as follows:
-
 Nasdaq Composite officially entered bear market
-
Nasdaq Composite Courts Bear Market Territory
-
S&P 500 And Nasdaq Composite Close To Record Highs
-
Biotech Boosts S&P 500 And Nasdaq Composite
-
Nasdaq Composite Hits Record High
About author

Online


Add a comment
Comments
0 comments on the analysis NASDAQ COMPOSITE INDEX - Daily