NASDAQ COMPOSITE INDEX - Daily - Technical analysis published on 06/17/2024 (GMT)
- 232
- 0
Click here for a new analysis!
- Timeframe : Daily
- - Analysis generated on
- Status : LEVEL MAINTAINED
Summary of the analysis

Additional analysis
Quotes
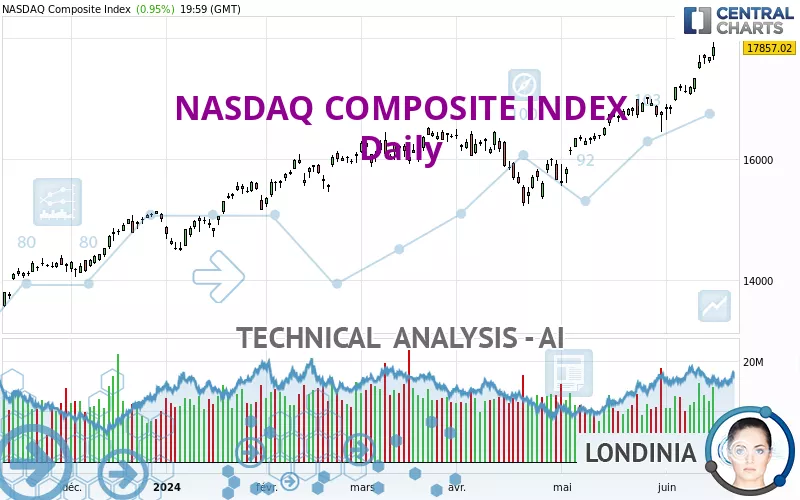
The NASDAQ COMPOSITE INDEX price is 17,857.02 USD. The price registered an increase of +0.95% on the session and was between 17,636.36 USD and 17,935.98 USD. This implies that the price is at +1.25% from its lowest and at -0.44% from its highest.The Central Gaps scanner detects the formation of a bullish gap marking the strong presence of buyers against sellers at the opening. This formed a quotation gap.
Opening Gap UP
Type : Bullish
Timeframe : Openning
Here is a more detailed summary of the historical variations registered by NASDAQ COMPOSITE INDEX:
New HIGH record (5 years)
Type : Bullish
Timeframe : Weekly
New HIGH record (1 year)
Type : Bullish
Timeframe : Weekly
New HIGH record (1st january)
Type : Bullish
Timeframe : Weekly
New HIGH record (1 month)
Type : Bullish
Timeframe : Weekly
Technical
Technical analysis of this Daily chart of NASDAQ COMPOSITE INDEX indicates that the overall trend is strongly bullish. 92.86% of the signals given by moving averages are bullish. The overall trend is supported by the strong bullish signals from short-term moving averages. There is no crossing of moving average by the price or crossing of moving averages between themselves.
The probability of a further increase is high given the direction of the technical indicators.
Caution: the Central Indicators scanner currently detects an excess:
RSI indicator is overbought : over 70
Type : Neutral
Timeframe : Daily
CCI indicator is overbought : over 100
Type : Neutral
Timeframe : Daily
Williams %R indicator is overbought : over -20
Type : Neutral
Timeframe : Daily
Pivot points : price is over resistance 3
Type : Neutral
Timeframe : Daily
The analysis of the price chart with Central Patterns scanners does not return any result.
The Central Candlesticks scanner, specialised in Japanese candlesticks, did not identify any signals.
| S3 | S2 | S1 | Price | |
|---|---|---|---|---|
| ProTrendLines | 15,282.01 | 16,057.40 | 16,437.74 | 17,857.02 |
| Change (%) | -14.42% | -10.08% | -7.95% | - |
| Change | -2,575.01 | -1,799.62 | -1,419.28 | - |
| Level | Intermediate | Major | Major | - |
Attention could also be paid to pivot points to set price objectives:
| Pivot points | S3 | S2 | S1 | PP | R1 | R2 | R3 |
|---|---|---|---|---|---|---|---|
| Standard | 17,383.97 | 17,510.17 | 17,683.59 | 17,809.79 | 17,983.21 | 18,109.41 | 18,282.83 |
| Camarilla | 17,774.63 | 17,802.09 | 17,829.56 | 17,857.02 | 17,884.49 | 17,911.95 | 17,939.42 |
| Woodie | 17,407.59 | 17,521.98 | 17,707.21 | 17,821.60 | 18,006.83 | 18,121.22 | 18,306.45 |
| Fibonacci | 17,510.17 | 17,624.62 | 17,695.33 | 17,809.79 | 17,924.24 | 17,994.95 | 18,109.41 |
| Pivot points | S3 | S2 | S1 | PP | R1 | R2 | R3 |
|---|---|---|---|---|---|---|---|
| Standard | 16,565.75 | 16,811.55 | 17,250.21 | 17,496.01 | 17,934.67 | 18,180.47 | 18,619.13 |
| Camarilla | 17,500.65 | 17,563.40 | 17,626.14 | 17,688.88 | 17,751.62 | 17,814.36 | 17,877.11 |
| Woodie | 16,662.19 | 16,859.77 | 17,346.65 | 17,544.23 | 18,031.11 | 18,228.69 | 18,715.57 |
| Fibonacci | 16,811.55 | 17,073.01 | 17,234.54 | 17,496.01 | 17,757.47 | 17,919.00 | 18,180.47 |
| Pivot points | S3 | S2 | S1 | PP | R1 | R2 | R3 |
|---|---|---|---|---|---|---|---|
| Standard | 14,375.87 | 14,966.75 | 15,850.89 | 16,441.77 | 17,325.91 | 17,916.79 | 18,800.93 |
| Camarilla | 16,329.39 | 16,464.60 | 16,599.81 | 16,735.02 | 16,870.23 | 17,005.44 | 17,140.65 |
| Woodie | 14,522.49 | 15,040.07 | 15,997.51 | 16,515.09 | 17,472.53 | 17,990.11 | 18,947.55 |
| Fibonacci | 14,966.75 | 15,530.21 | 15,878.32 | 16,441.77 | 17,005.23 | 17,353.34 | 17,916.79 |
Numerical data
The following is the status of technical indicators and moving averages registered at the time this technical analysis was created:
| RSI (14): | 79.86 | |
| MACD (12,26,9): | 338.4500 | |
| Directional Movement: | 29.41 | |
| AROON (14): | 78.57 | |
| DEMA (21): | 17,571.70 | |
| Parabolic SAR (0,02-0,02-0,2): | 16,887.98 | |
| Elder Ray (13): | 453.58 | |
| Super Trend (3,10): | 17,155.53 | |
| Zig ZAG (10): | 17,857.02 | |
| VORTEX (21): | 1.1400 | |
| Stochastique (14,3,5): | 94.96 | |
| TEMA (21): | 17,721.33 | |
| Williams %R (14): | -5.30 | |
| Chande Momentum Oscillator (20): | 1,119.94 | |
| Repulse (5,40,3): | 2.1100 | |
| ROCnROLL: | 1 | |
| TRIX (15,9): | 0.2400 | |
| Courbe Coppock: | 8.20 |
| MA7: | 17,498.73 | |
| MA20: | 17,101.81 | |
| MA50: | 16,480.87 | |
| MA100: | 16,230.28 | |
| MAexp7: | 17,542.91 | |
| MAexp20: | 17,149.72 | |
| MAexp50: | 16,681.09 | |
| MAexp100: | 16,191.53 | |
| Price / MA7: | +2.05% | |
| Price / MA20: | +4.42% | |
| Price / MA50: | +8.35% | |
| Price / MA100: | +10.02% | |
| Price / MAexp7: | +1.79% | |
| Price / MAexp20: | +4.12% | |
| Price / MAexp50: | +7.05% | |
| Price / MAexp100: | +10.29% |
News
The latest news and videos published on NASDAQ COMPOSITE INDEX at the time of the analysis were as follows:
-
 Nasdaq Composite officially entered bear market
-
Nasdaq Composite Courts Bear Market Territory
-
S&P 500 And Nasdaq Composite Close To Record Highs
-
Biotech Boosts S&P 500 And Nasdaq Composite
-
Nasdaq Composite Hits Record High
About author

Online


Add a comment
Comments
0 comments on the analysis NASDAQ COMPOSITE INDEX - Daily