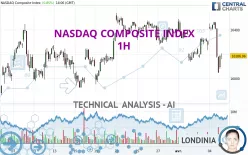
NASDAQ COMPOSITE INDEX - 1H - Technical analysis published on 04/05/2024 (GMT)
- 230
- 0
Click here for a new analysis!
- Timeframe : 1H
- - Analysis generated on
- Status : LEVEL MAINTAINED

Summary of the analysis

Additional analysis
Quotes
The NASDAQ COMPOSITE INDEX rating is 16,192.02 USD. The price registered an increase of +0.89% on the session with the lowest point at 16,080.48 USD and the highest point at 16,195.34 USD. The deviation from the price is +0.69% for the low point and -0.02% for the high point.A study of price movements over other periods shows the following variations:
Near a new HIGH record (5 years)
Type : Bullish
Timeframe : Weekly
Technical
Technical analysis of this 1H chart of NASDAQ COMPOSITE INDEX indicates that the overall trend is bearish. 71.43% of the signals given by moving averages are bearish. This bearish trend is supported by the strong bearish signals given by short-term moving averages. There is no crossing of moving average by the price or crossing of moving averages between themselves.
In fact, Central Analyzer took into account 18 technical indicators and the result was as follows: 4 are bullish, 4 are neutral and 10 are bearish. But beware of excesses. The Central Indicators scanner currently detects this:
CCI indicator is oversold : under -100
Type : Neutral
Timeframe : 1 hour
Previous candle closed under Bollinger bands
Type : Neutral
Timeframe : 1 hour
Pivot points : price is under support 3
Type : Neutral
Timeframe : Weekly
The analysis of the price chart with Central Patterns scanners does not return any result.
The presence of these Japanese chandelier patterns detected by Central Candlesticks that could impact the current short-term trend were also noted:
Bullish harami
Type : Bullish
Timeframe : 1 hour
Bearish harami
Type : Bearish
Timeframe : 1 hour
Bearish harami cross
Type : Bearish
Timeframe : 1 hour
| S3 | S2 | S1 | Price | R1 | R2 | R3 | |
|---|---|---|---|---|---|---|---|
| ProTrendLines | 15,978.16 | 16,057.40 | 16,137.91 | 16,192.02 | 16,302.20 | 16,362.65 | 16,538.87 |
| Change (%) | -1.32% | -0.83% | -0.33% | - | +0.68% | +1.05% | +2.14% |
| Change | -213.86 | -134.62 | -54.11 | - | +110.18 | +170.63 | +346.85 |
| Level | Minor | Major | Intermediate | - | Intermediate | Minor | Intermediate |
To determine price objectives, it is also possible to use the pivot points. Here is the price position in relation to pivot points:
| Pivot points | S3 | S2 | S1 | PP | R1 | R2 | R3 |
|---|---|---|---|---|---|---|---|
| Standard | 15,486.27 | 15,766.41 | 15,907.75 | 16,187.89 | 16,329.23 | 16,609.37 | 16,750.71 |
| Camarilla | 15,933.17 | 15,971.81 | 16,010.44 | 16,049.08 | 16,087.72 | 16,126.35 | 16,164.99 |
| Woodie | 15,416.86 | 15,731.71 | 15,838.34 | 16,153.19 | 16,259.82 | 16,574.67 | 16,681.30 |
| Fibonacci | 15,766.41 | 15,927.42 | 16,026.89 | 16,187.89 | 16,348.90 | 16,448.37 | 16,609.37 |
| Pivot points | S3 | S2 | S1 | PP | R1 | R2 | R3 |
|---|---|---|---|---|---|---|---|
| Standard | 16,083.08 | 16,181.13 | 16,280.29 | 16,378.34 | 16,477.50 | 16,575.55 | 16,674.71 |
| Camarilla | 16,325.23 | 16,343.31 | 16,361.38 | 16,379.46 | 16,397.54 | 16,415.62 | 16,433.69 |
| Woodie | 16,083.65 | 16,181.41 | 16,280.86 | 16,378.62 | 16,478.07 | 16,575.83 | 16,675.28 |
| Fibonacci | 16,181.13 | 16,256.46 | 16,303.00 | 16,378.34 | 16,453.67 | 16,500.21 | 16,575.55 |
| Pivot points | S3 | S2 | S1 | PP | R1 | R2 | R3 |
|---|---|---|---|---|---|---|---|
| Standard | 15,305.53 | 15,584.08 | 15,981.77 | 16,260.32 | 16,658.01 | 16,936.56 | 17,334.25 |
| Camarilla | 16,193.49 | 16,255.48 | 16,317.47 | 16,379.46 | 16,441.45 | 16,503.44 | 16,565.43 |
| Woodie | 15,365.10 | 15,613.87 | 16,041.34 | 16,290.11 | 16,717.58 | 16,966.35 | 17,393.82 |
| Fibonacci | 15,584.08 | 15,842.40 | 16,002.00 | 16,260.32 | 16,518.64 | 16,678.24 | 16,936.56 |
Numerical data
The following are the details of the technical indicators and moving averages that were collected to generate this technical analysis:
| RSI (14): | 41.42 | |
| MACD (12,26,9): | -25.4300 | |
| Directional Movement: | -24.14 | |
| AROON (14): | -21.43 | |
| DEMA (21): | 16,263.85 | |
| Parabolic SAR (0,02-0,02-0,2): | 16,445.49 | |
| Elder Ray (13): | -152.99 | |
| Super Trend (3,10): | 16,360.71 | |
| Zig ZAG (10): | 16,175.54 | |
| VORTEX (21): | 0.8300 | |
| Stochastique (14,3,5): | 12.77 | |
| TEMA (21): | 16,256.05 | |
| Williams %R (14): | -65.20 | |
| Chande Momentum Oscillator (20): | -110.54 | |
| Repulse (5,40,3): | -0.7700 | |
| ROCnROLL: | 2 | |
| TRIX (15,9): | 0.0000 | |
| Courbe Coppock: | 0.53 |
| MA7: | 16,273.17 | |
| MA20: | 16,235.27 | |
| MA50: | 15,977.50 | |
| MA100: | 15,301.42 | |
| MAexp7: | 16,227.74 | |
| MAexp20: | 16,287.55 | |
| MAexp50: | 16,308.24 | |
| MAexp100: | 16,278.20 | |
| Price / MA7: | -0.50% | |
| Price / MA20: | -0.27% | |
| Price / MA50: | +1.34% | |
| Price / MA100: | +5.82% | |
| Price / MAexp7: | -0.22% | |
| Price / MAexp20: | -0.59% | |
| Price / MAexp50: | -0.71% | |
| Price / MAexp100: | -0.53% |
News
The latest news and videos published on NASDAQ COMPOSITE INDEX at the time of the analysis were as follows:
-
 Nasdaq Composite officially entered bear market
-
Nasdaq Composite Courts Bear Market Territory
-
S&P 500 And Nasdaq Composite Close To Record Highs
-
Biotech Boosts S&P 500 And Nasdaq Composite
-
Nasdaq Composite Hits Record High
About author

Online


Add a comment
Comments
0 comments on the analysis NASDAQ COMPOSITE INDEX - 1H