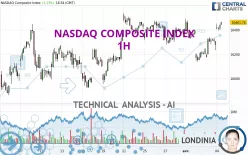
NASDAQ COMPOSITE INDEX - 1H - Technical analysis published on 04/04/2024 (GMT)
- 262
- 0
Click here for a new analysis!
- Timeframe : 1H
- - Analysis generated on
- Status : INVALID

Summary of the analysis

Additional analysis
Quotes
The NASDAQ COMPOSITE INDEX price is 16,460.07 USD. The price registered an increase of +1.12% on the session and was traded between 16,393.99 USD and 16,464.30 USD over the period. The price is currently at +0.40% from its lowest and -0.03% from its highest.The Central Gaps scanner detects a bullish gap which is a sign that buyers have taken the lead in the very short term.
Opening Gap UP
Type : Bullish
Timeframe : Openning
A study of price movements over other periods shows the following variations:
Near a new HIGH record (5 years)
Type : Bullish
Timeframe : Weekly
Near a new HIGH record (1 year)
Type : Bullish
Timeframe : Weekly
Near a new HIGH record (1st january)
Type : Bullish
Timeframe : Weekly
Near a new LOW record (1 month)
Type : Bearish
Timeframe : Weekly
Technical
Technical analysis of this 1H chart of NASDAQ COMPOSITE INDEX indicates that the overall trend is strongly bullish. 89.29% of the signals given by moving averages are bullish. The overall trend is supported by the strong bullish signals from short-term moving averages. The Central Indicators market scanner currently does not detect any result that concerns moving averages.
In fact, according to the parameters integrated into the Central Analyzer system, 15 technical indicators out of 18 analysed are currently bullish. Caution: the Central Indicators scanner currently detects an excess:
CCI indicator is overbought : over 100
Type : Neutral
Timeframe : 1 hour
Williams %R indicator is overbought : over -20
Type : Neutral
Timeframe : 1 hour
Pivot points : price is over resistance 2
Type : Neutral
Timeframe : 1 hour
The analysis of the price chart with Central Patterns scanners does not return any result.
The Central Candlesticks scanner, specialised in Japanese candlesticks, did not identify any signals.
| S3 | S2 | S1 | Price | R1 | |
|---|---|---|---|---|---|
| ProTrendLines | 16,137.54 | 16,302.20 | 16,362.65 | 16,460.07 | 16,538.87 |
| Change (%) | -1.96% | -0.96% | -0.59% | - | +0.48% |
| Change | -322.53 | -157.87 | -97.42 | - | +78.80 |
| Level | Intermediate | Intermediate | Minor | - | Intermediate |
Attention could also be paid to pivot points to set price objectives:
| Pivot points | S3 | S2 | S1 | PP | R1 | R2 | R3 |
|---|---|---|---|---|---|---|---|
| Standard | 16,012.84 | 16,091.07 | 16,184.27 | 16,262.50 | 16,355.70 | 16,433.93 | 16,527.13 |
| Camarilla | 16,230.32 | 16,246.03 | 16,261.75 | 16,277.46 | 16,293.17 | 16,308.89 | 16,324.60 |
| Woodie | 16,020.32 | 16,094.81 | 16,191.75 | 16,266.24 | 16,363.18 | 16,437.67 | 16,534.61 |
| Fibonacci | 16,091.07 | 16,156.56 | 16,197.02 | 16,262.50 | 16,327.99 | 16,368.45 | 16,433.93 |
| Pivot points | S3 | S2 | S1 | PP | R1 | R2 | R3 |
|---|---|---|---|---|---|---|---|
| Standard | 16,083.08 | 16,181.13 | 16,280.29 | 16,378.34 | 16,477.50 | 16,575.55 | 16,674.71 |
| Camarilla | 16,325.23 | 16,343.31 | 16,361.38 | 16,379.46 | 16,397.54 | 16,415.62 | 16,433.69 |
| Woodie | 16,083.65 | 16,181.41 | 16,280.86 | 16,378.62 | 16,478.07 | 16,575.83 | 16,675.28 |
| Fibonacci | 16,181.13 | 16,256.46 | 16,303.00 | 16,378.34 | 16,453.67 | 16,500.21 | 16,575.55 |
| Pivot points | S3 | S2 | S1 | PP | R1 | R2 | R3 |
|---|---|---|---|---|---|---|---|
| Standard | 15,305.53 | 15,584.08 | 15,981.77 | 16,260.32 | 16,658.01 | 16,936.56 | 17,334.25 |
| Camarilla | 16,193.49 | 16,255.48 | 16,317.47 | 16,379.46 | 16,441.45 | 16,503.44 | 16,565.43 |
| Woodie | 15,365.10 | 15,613.87 | 16,041.34 | 16,290.11 | 16,717.58 | 16,966.35 | 17,393.82 |
| Fibonacci | 15,584.08 | 15,842.40 | 16,002.00 | 16,260.32 | 16,518.64 | 16,678.24 | 16,936.56 |
Numerical data
The following is the status of technical indicators and moving averages registered at the time this technical analysis was created:
| RSI (14): | 62.38 | |
| MACD (12,26,9): | 22.3300 | |
| Directional Movement: | 12.27 | |
| AROON (14): | 100.00 | |
| DEMA (21): | 16,354.31 | |
| Parabolic SAR (0,02-0,02-0,2): | 16,155.69 | |
| Elder Ray (13): | 98.78 | |
| Super Trend (3,10): | 16,275.71 | |
| Zig ZAG (10): | 16,459.01 | |
| VORTEX (21): | 1.0400 | |
| Stochastique (14,3,5): | 93.57 | |
| TEMA (21): | 16,388.08 | |
| Williams %R (14): | -3.08 | |
| Chande Momentum Oscillator (20): | 253.15 | |
| Repulse (5,40,3): | 0.2400 | |
| ROCnROLL: | 1 | |
| TRIX (15,9): | -0.0100 | |
| Courbe Coppock: | 1.81 |
| MA7: | 16,352.74 | |
| MA20: | 16,262.15 | |
| MA50: | 15,972.49 | |
| MA100: | 15,279.26 | |
| MAexp7: | 16,390.17 | |
| MAexp20: | 16,338.60 | |
| MAexp50: | 16,328.36 | |
| MAexp100: | 16,286.09 | |
| Price / MA7: | +0.66% | |
| Price / MA20: | +1.22% | |
| Price / MA50: | +3.05% | |
| Price / MA100: | +7.73% | |
| Price / MAexp7: | +0.43% | |
| Price / MAexp20: | +0.74% | |
| Price / MAexp50: | +0.81% | |
| Price / MAexp100: | +1.07% |
News
The latest news and videos published on NASDAQ COMPOSITE INDEX at the time of the analysis were as follows:
-
 Nasdaq Composite officially entered bear market
-
Nasdaq Composite Courts Bear Market Territory
-
S&P 500 And Nasdaq Composite Close To Record Highs
-
Biotech Boosts S&P 500 And Nasdaq Composite
-
Nasdaq Composite Hits Record High
About author

Online


Add a comment
Comments
0 comments on the analysis NASDAQ COMPOSITE INDEX - 1H