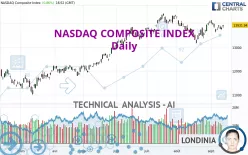
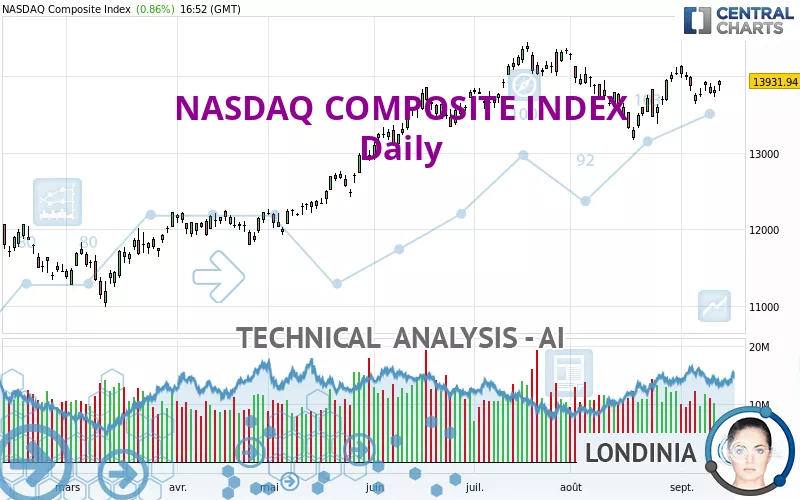
NASDAQ COMPOSITE INDEX - Daily - Technical analysis published on 09/14/2023 (GMT)
- 168
- 0
Click here for a new analysis!
- Timeframe : Daily
- - Analysis generated on
- Status : INVALID
Summary of the analysis

Additional analysis
Quotes
The NASDAQ COMPOSITE INDEX price is 13,932.04 USD. On the day, this instrument gained +0.86% with the lowest point at 13,810.66 USD and the highest point at 13,944.98 USD. The deviation from the price is +0.88% for the low point and -0.09% for the high point.The Central Gaps scanner detects a bullish gap which is a sign that buyers have taken the lead in the very short term.
Opening Gap UP
Type : Bullish
Timeframe : Openning
Here is a more detailed summary of the historical variations registered by NASDAQ COMPOSITE INDEX:
Near a new HIGH record (1 year)
Type : Bullish
Timeframe : Weekly
Near a new HIGH record (1st january)
Type : Bullish
Timeframe : Weekly
Near a new LOW record (1 month)
Type : Bearish
Timeframe : Weekly
Technical
Technical analysis of this Daily chart of NASDAQ COMPOSITE INDEX indicates that the overall trend is strongly bullish. The signals given by the moving averages are 89.29% bullish. This strong bullish trend is confirmed by the strong signals currently being given by short-term moving averages. The Central Indicators market scanner is currently detecting several bullish signals that could impact this trend:
Bullish price crossover with Moving Average 50
Type : Bullish
Timeframe : Daily
Bullish price crossover with adaptative moving average 50
Type : Bullish
Timeframe : Daily
In fact, according to the parameters integrated into the Central Analyzer system, 10 technical indicators out of 18 analysed are currently bullish. Central Indicators, the detector scanner for these technical indicators recently detected a signal:
Pivot points : price is over resistance 1
Type : Neutral
Timeframe : Daily
No signals are given by Central Patterns, a market scanner specialised in chart patterns, resistances and supports.
No result was found by the Central Candlesticks scanner on Japanese candlesticks.
| S3 | S2 | S1 | Price | R1 | R2 | |
|---|---|---|---|---|---|---|
| ProTrendLines | 11,138.90 | 12,056.44 | 13,128.10 | 13,932.04 | 14,320.08 | 16,057.40 |
| Change (%) | -20.05% | -13.46% | -5.77% | - | +2.79% | +15.26% |
| Change | -2,793.14 | -1,875.60 | -803.94 | - | +388.04 | +2,125.36 |
| Level | Minor | Intermediate | Major | - | Major | Major |
Pivot points can also be used to set your price objectives. Here is the price situation in relation to pivot points:
| Pivot points | S3 | S2 | S1 | PP | R1 | R2 | R3 |
|---|---|---|---|---|---|---|---|
| Standard | 13,607.33 | 13,670.57 | 13,742.08 | 13,805.32 | 13,876.83 | 13,940.07 | 14,011.58 |
| Camarilla | 13,776.52 | 13,788.88 | 13,801.23 | 13,813.58 | 13,825.93 | 13,838.28 | 13,850.64 |
| Woodie | 13,611.46 | 13,672.64 | 13,746.21 | 13,807.39 | 13,880.96 | 13,942.14 | 14,015.71 |
| Fibonacci | 13,670.57 | 13,722.05 | 13,753.85 | 13,805.32 | 13,856.80 | 13,888.60 | 13,940.07 |
| Pivot points | S3 | S2 | S1 | PP | R1 | R2 | R3 |
|---|---|---|---|---|---|---|---|
| Standard | 13,164.00 | 13,403.24 | 13,582.38 | 13,821.62 | 14,000.76 | 14,240.00 | 14,419.14 |
| Camarilla | 13,646.48 | 13,684.83 | 13,723.18 | 13,761.53 | 13,799.88 | 13,838.23 | 13,876.59 |
| Woodie | 13,133.96 | 13,388.22 | 13,552.34 | 13,806.60 | 13,970.72 | 14,224.98 | 14,389.10 |
| Fibonacci | 13,403.24 | 13,563.06 | 13,661.80 | 13,821.62 | 13,981.44 | 14,080.18 | 14,240.00 |
| Pivot points | S3 | S2 | S1 | PP | R1 | R2 | R3 |
|---|---|---|---|---|---|---|---|
| Standard | 12,214.05 | 12,687.92 | 13,361.45 | 13,835.32 | 14,508.85 | 14,982.72 | 15,656.25 |
| Camarilla | 13,719.44 | 13,824.61 | 13,929.79 | 14,034.97 | 14,140.15 | 14,245.33 | 14,350.51 |
| Woodie | 12,313.87 | 12,737.84 | 13,461.27 | 13,885.24 | 14,608.67 | 15,032.64 | 15,756.07 |
| Fibonacci | 12,687.92 | 13,126.23 | 13,397.02 | 13,835.32 | 14,273.63 | 14,544.42 | 14,982.72 |
Numerical data
The following is the status of technical indicators and moving averages registered at the time this technical analysis was created:
| RSI (14): | 53.97 | |
| MACD (12,26,9): | 24.9200 | |
| Directional Movement: | 5.89 | |
| AROON (14): | 35.72 | |
| DEMA (21): | 13,846.32 | |
| Parabolic SAR (0,02-0,02-0,2): | 14,100.90 | |
| Elder Ray (13): | 41.96 | |
| Super Trend (3,10): | 13,482.53 | |
| Zig ZAG (10): | 13,919.30 | |
| VORTEX (21): | 1.0000 | |
| Stochastique (14,3,5): | 59.39 | |
| TEMA (21): | 13,855.60 | |
| Williams %R (14): | -29.87 | |
| Chande Momentum Oscillator (20): | 214.34 | |
| Repulse (5,40,3): | 0.4600 | |
| ROCnROLL: | 1 | |
| TRIX (15,9): | 0.0100 | |
| Courbe Coppock: | 4.27 |
| MA7: | 13,830.51 | |
| MA20: | 13,747.47 | |
| MA50: | 13,880.14 | |
| MA100: | 13,382.39 | |
| MAexp7: | 13,855.45 | |
| MAexp20: | 13,821.91 | |
| MAexp50: | 13,726.69 | |
| MAexp100: | 13,359.34 | |
| Price / MA7: | +0.73% | |
| Price / MA20: | +1.34% | |
| Price / MA50: | +0.37% | |
| Price / MA100: | +4.11% | |
| Price / MAexp7: | +0.55% | |
| Price / MAexp20: | +0.80% | |
| Price / MAexp50: | +1.50% | |
| Price / MAexp100: | +4.29% |
News
Don't forget to follow the news on NASDAQ COMPOSITE INDEX. At the time of publication of this analysis, the latest news was as follows:
-
 Nasdaq Composite officially entered bear market
-
Nasdaq Composite Courts Bear Market Territory
-
S&P 500 And Nasdaq Composite Close To Record Highs
-
Biotech Boosts S&P 500 And Nasdaq Composite
-
Nasdaq Composite Hits Record High
About author

Online


Add a comment
Comments
0 comments on the analysis NASDAQ COMPOSITE INDEX - Daily