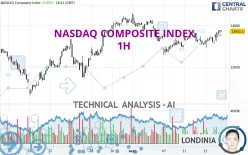
NASDAQ COMPOSITE INDEX - 1H - Technical analysis published on 09/14/2023 (GMT)
- 147
- 0
Click here for a new analysis!
- Timeframe : 1H
- - Analysis generated on
- Status : INVALID

Summary of the analysis

Additional analysis
Quotes
The NASDAQ COMPOSITE INDEX price is 13,931.02 USD. On the day, this instrument gained +0.85% with the lowest point at 13,810.66 USD and the highest point at 13,944.98 USD. The deviation from the price is +0.87% for the low point and -0.10% for the high point.The Central Gaps scanner detects a bullish gap which is a sign that buyers have taken the lead in the very short term.
Opening Gap UP
Type : Bullish
Timeframe : Openning
Here is a more detailed summary of the historical variations registered by NASDAQ COMPOSITE INDEX:
Near a new HIGH record (1 year)
Type : Bullish
Timeframe : Weekly
Near a new HIGH record (1st january)
Type : Bullish
Timeframe : Weekly
Near a new LOW record (1 month)
Type : Bearish
Timeframe : Weekly
Technical
A technical analysis in 1H of this NASDAQ COMPOSITE INDEX chart shows a strongly bullish trend. 85.71% of the signals given by moving averages are bullish. The overall trend is supported by the strong bullish signals from short-term moving averages. The Central Indicators scanner does not detect any result on moving averages that would impact this trend.
An assessment of technical indicators shows a strong bullish signal.
Caution: the Central Indicators scanner currently detects an excess:
CCI indicator is overbought : over 100
Type : Neutral
Timeframe : 1 hour
CCI indicator: bearish divergence
Type : Bearish
Timeframe : 1 hour
RSI indicator: bearish divergence
Type : Bearish
Timeframe : 1 hour
Williams %R indicator is overbought : over -20
Type : Neutral
Timeframe : 1 hour
Pivot points : price is over resistance 1
Type : Neutral
Timeframe : 1 hour
The analysis of the price chart with Central Patterns scanners does not return any result.
No result was found by the Central Candlesticks scanner on Japanese candlesticks.
| S3 | S2 | S1 | Price | R1 | R2 | R3 | |
|---|---|---|---|---|---|---|---|
| ProTrendLines | 13,481.76 | 13,641.29 | 13,836.42 | 13,931.02 | 13,941.39 | 14,060.85 | 14,149.62 |
| Change (%) | -3.22% | -2.08% | -0.68% | - | +0.07% | +0.93% | +1.57% |
| Change | -449.26 | -289.73 | -94.60 | - | +10.37 | +129.83 | +218.60 |
| Level | Minor | Intermediate | Minor | - | Major | Minor | Intermediate |
Pivot points can also be used to set your price objectives. Here is the price situation in relation to pivot points:
| Pivot points | S3 | S2 | S1 | PP | R1 | R2 | R3 |
|---|---|---|---|---|---|---|---|
| Standard | 13,607.33 | 13,670.57 | 13,742.08 | 13,805.32 | 13,876.83 | 13,940.07 | 14,011.58 |
| Camarilla | 13,776.52 | 13,788.88 | 13,801.23 | 13,813.58 | 13,825.93 | 13,838.28 | 13,850.64 |
| Woodie | 13,611.46 | 13,672.64 | 13,746.21 | 13,807.39 | 13,880.96 | 13,942.14 | 14,015.71 |
| Fibonacci | 13,670.57 | 13,722.05 | 13,753.85 | 13,805.32 | 13,856.80 | 13,888.60 | 13,940.07 |
| Pivot points | S3 | S2 | S1 | PP | R1 | R2 | R3 |
|---|---|---|---|---|---|---|---|
| Standard | 13,164.00 | 13,403.24 | 13,582.38 | 13,821.62 | 14,000.76 | 14,240.00 | 14,419.14 |
| Camarilla | 13,646.48 | 13,684.83 | 13,723.18 | 13,761.53 | 13,799.88 | 13,838.23 | 13,876.59 |
| Woodie | 13,133.96 | 13,388.22 | 13,552.34 | 13,806.60 | 13,970.72 | 14,224.98 | 14,389.10 |
| Fibonacci | 13,403.24 | 13,563.06 | 13,661.80 | 13,821.62 | 13,981.44 | 14,080.18 | 14,240.00 |
| Pivot points | S3 | S2 | S1 | PP | R1 | R2 | R3 |
|---|---|---|---|---|---|---|---|
| Standard | 12,214.05 | 12,687.92 | 13,361.45 | 13,835.32 | 14,508.85 | 14,982.72 | 15,656.25 |
| Camarilla | 13,719.44 | 13,824.61 | 13,929.79 | 14,034.97 | 14,140.15 | 14,245.33 | 14,350.51 |
| Woodie | 12,313.87 | 12,737.84 | 13,461.27 | 13,885.24 | 14,608.67 | 15,032.64 | 15,756.07 |
| Fibonacci | 12,687.92 | 13,126.23 | 13,397.02 | 13,835.32 | 14,273.63 | 14,544.42 | 14,982.72 |
Numerical data
The following is the status of the technical indicators and moving averages at the time of publication of this technical analysis:
| RSI (14): | 60.72 | |
| MACD (12,26,9): | 15.5500 | |
| Directional Movement: | 9.06 | |
| AROON (14): | 57.15 | |
| DEMA (21): | 13,867.77 | |
| Parabolic SAR (0,02-0,02-0,2): | 13,773.31 | |
| Elder Ray (13): | 59.18 | |
| Super Trend (3,10): | 13,761.86 | |
| Zig ZAG (10): | 13,919.71 | |
| VORTEX (21): | 1.0500 | |
| Stochastique (14,3,5): | 91.47 | |
| TEMA (21): | 13,890.43 | |
| Williams %R (14): | -12.24 | |
| Chande Momentum Oscillator (20): | 139.91 | |
| Repulse (5,40,3): | 0.3400 | |
| ROCnROLL: | 1 | |
| TRIX (15,9): | 0.0000 | |
| Courbe Coppock: | 0.50 |
| MA7: | 13,830.51 | |
| MA20: | 13,747.47 | |
| MA50: | 13,880.14 | |
| MA100: | 13,382.39 | |
| MAexp7: | 13,884.95 | |
| MAexp20: | 13,853.70 | |
| MAexp50: | 13,846.69 | |
| MAexp100: | 13,831.40 | |
| Price / MA7: | +0.73% | |
| Price / MA20: | +1.34% | |
| Price / MA50: | +0.37% | |
| Price / MA100: | +4.10% | |
| Price / MAexp7: | +0.33% | |
| Price / MAexp20: | +0.56% | |
| Price / MAexp50: | +0.61% | |
| Price / MAexp100: | +0.72% |
News
Don't forget to follow the news on NASDAQ COMPOSITE INDEX. At the time of publication of this analysis, the latest news was as follows:
-
 Nasdaq Composite officially entered bear market
-
Nasdaq Composite Courts Bear Market Territory
-
S&P 500 And Nasdaq Composite Close To Record Highs
-
Biotech Boosts S&P 500 And Nasdaq Composite
-
Nasdaq Composite Hits Record High
About author

Online


Add a comment
Comments
0 comments on the analysis NASDAQ COMPOSITE INDEX - 1H