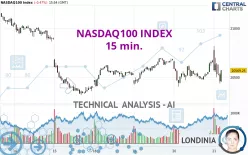
NASDAQ100 INDEX - 15 min. - Technical analysis published on 11/21/2024 (GMT)
- 149
- 0
Click here for a new analysis!
- Timeframe : 15 min.
- - Analysis generated on
- Status : TARGET REACHED

Summary of the analysis

Additional analysis
Quotes
The NASDAQ100 INDEX price is 20,569.25 USD. The price is lower by -0.47% since the last closing and was between 20,436.80 USD and 20,814.93 USD. This implies that the price is at +0.65% from its lowest and at -1.18% from its highest.A study of price movements over other periods shows the following variations:
Near a new HIGH record (5 years)
Type : Bullish
Timeframe : Weekly
Near a new HIGH record (1 year)
Type : Bullish
Timeframe : Weekly
Near a new HIGH record (1st january)
Type : Bullish
Timeframe : Weekly
Near a new LOW record (1 month)
Type : Bearish
Timeframe : Weekly
Technical
A technical analysis in 15 min. of this NASDAQ100 INDEX chart shows a bullish trend. 64.29% of the signals given by moving averages are bullish. Caution: the neutral signals currently given by the short-term moving averages indicate that this bullish trend is showing signs of running out of steam. The Central Indicators market scanner currently does not detect any result that concerns moving averages.
In fact, Central Analyzer took into account 18 technical indicators and the result was as follows: 9 are bullish, 4 are neutral and 5 are bearish. Central Indicators, the scanner specialised in technical indicators, has identified these signals:
RSI indicator is back under 50
Type : Bearish
Timeframe : 15 minutes
Ichimoku : price is under the cloud
Type : Bearish
Timeframe : 15 minutes
SuperTrend indicator bearish reversal
Type : Bearish
Timeframe : 15 minutes
MACD indicator is back under 0
Type : Bearish
Timeframe : 15 minutes
No signals are given by Central Patterns, a market scanner specialised in chart patterns, resistances and supports.
No result was found by the Central Candlesticks scanner on Japanese candlesticks.
| S3 | S2 | S1 | Price | R1 | R2 | R3 | |
|---|---|---|---|---|---|---|---|
| ProTrendLines | 19,824.84 | 20,190.80 | 20,403.19 | 20,569.25 | 20,675.38 | 20,948.44 | 21,117.18 |
| Change (%) | -3.62% | -1.84% | -0.81% | - | +0.52% | +1.84% | +2.66% |
| Change | -744.41 | -378.45 | -166.06 | - | +106.13 | +379.19 | +547.93 |
| Level | Major | Minor | Intermediate | - | Major | Minor | Major |
To determine price objectives, it is also possible to use the pivot points. Here is the price position in relation to pivot points:
| Pivot points | S3 | S2 | S1 | PP | R1 | R2 | R3 |
|---|---|---|---|---|---|---|---|
| Standard | 20,213.54 | 20,308.04 | 20,487.57 | 20,582.07 | 20,761.60 | 20,856.10 | 21,035.63 |
| Camarilla | 20,591.74 | 20,616.86 | 20,641.98 | 20,667.10 | 20,692.22 | 20,717.34 | 20,742.46 |
| Woodie | 20,256.06 | 20,329.30 | 20,530.09 | 20,603.33 | 20,804.12 | 20,877.36 | 21,078.15 |
| Fibonacci | 20,308.04 | 20,412.72 | 20,477.39 | 20,582.07 | 20,686.75 | 20,751.42 | 20,856.10 |
| Pivot points | S3 | S2 | S1 | PP | R1 | R2 | R3 |
|---|---|---|---|---|---|---|---|
| Standard | 19,211.85 | 19,763.46 | 20,078.80 | 20,630.41 | 20,945.75 | 21,497.36 | 21,812.70 |
| Camarilla | 20,155.72 | 20,235.19 | 20,314.66 | 20,394.13 | 20,473.60 | 20,553.07 | 20,632.54 |
| Woodie | 19,093.71 | 19,704.39 | 19,960.66 | 20,571.34 | 20,827.61 | 21,438.29 | 21,694.56 |
| Fibonacci | 19,763.46 | 20,094.64 | 20,299.24 | 20,630.41 | 20,961.59 | 21,166.19 | 21,497.36 |
| Pivot points | S3 | S2 | S1 | PP | R1 | R2 | R3 |
|---|---|---|---|---|---|---|---|
| Standard | 18,497.30 | 19,059.79 | 19,475.11 | 20,037.60 | 20,452.92 | 21,015.41 | 21,430.73 |
| Camarilla | 19,621.52 | 19,711.16 | 19,800.79 | 19,890.42 | 19,980.05 | 20,069.69 | 20,159.32 |
| Woodie | 18,423.71 | 19,023.00 | 19,401.52 | 20,000.81 | 20,379.33 | 20,978.62 | 21,357.14 |
| Fibonacci | 19,059.79 | 19,433.32 | 19,664.08 | 20,037.60 | 20,411.13 | 20,641.89 | 21,015.41 |
Numerical data
The following is the status of the technical indicators and moving averages at the time of publication of this technical analysis:
| RSI (14): | 57.46 | |
| MACD (12,26,9): | 15.7900 | |
| Directional Movement: | 17.83 | |
| AROON (14): | 50.00 | |
| DEMA (21): | 20,584.03 | |
| Parabolic SAR (0,02-0,02-0,2): | 20,808.62 | |
| Elder Ray (13): | 32.07 | |
| Super Trend (3,10): | 20,515.43 | |
| Zig ZAG (10): | 20,601.01 | |
| VORTEX (21): | 1.1000 | |
| Stochastique (14,3,5): | 35.11 | |
| TEMA (21): | 20,603.02 | |
| Williams %R (14): | -58.43 | |
| Chande Momentum Oscillator (20): | 105.55 | |
| Repulse (5,40,3): | -0.0500 | |
| ROCnROLL: | 1 | |
| TRIX (15,9): | 0.0000 | |
| Courbe Coppock: | 0.61 |
| MA7: | 20,665.52 | |
| MA20: | 20,583.14 | |
| MA50: | 20,227.69 | |
| MA100: | 19,784.80 | |
| MAexp7: | 20,575.39 | |
| MAexp20: | 20,571.77 | |
| MAexp50: | 20,567.89 | |
| MAexp100: | 20,606.69 | |
| Price / MA7: | -0.47% | |
| Price / MA20: | -0.07% | |
| Price / MA50: | +1.69% | |
| Price / MA100: | +3.96% | |
| Price / MAexp7: | -0.03% | |
| Price / MAexp20: | -0.01% | |
| Price / MAexp50: | +0.01% | |
| Price / MAexp100: | -0.18% |
News
The last news published on NASDAQ100 INDEX at the time of the generation of this analysis was as follows:
-
 Nasdaq 100, S&P 500, Dow Jones Price Forecast Today: NDX, SPX, DJIA Technical Analysis (November 21)
-
Nasdaq 100, S&P 500, Dow Jones Price Forecast Today: NDX, SPX, DJIA Technical Analysis (November 20)
-
Nasdaq 100, S&P 500, Dow Jones Price Forecast Today: NDX, SPX, DJIA Technical Analysis (November 19)
-
Nasdaq 100, S&P 500, Dow Jones Price Forecast Today: NDX, SPX, DJIA Technical Analysis (November 18)
-
Nasdaq 100, S&P 500, Dow Jones Price Forecast Today: NDX, SPX, DJIA Technical Analysis (November 15)
About author

Online


Add a comment
Comments
0 comments on the analysis NASDAQ100 INDEX - 15 min.